Breakoutwatch Weekly Summary 02/15/20
You are receiving this email because you are or were a BreakoutWatch.com subscriber, or have subscribed to our weekly newsletter. This newsletter summarizes the breakout events of the week and provides additional guidance that does not fit into our daily format. It is published each weekend.
| New Highs and 25 Breakouts
Delivered Average 5% gains The markets initially shrugged off fears that the coronavirus would deliver economic setbacks and set new highs on Tuesday of this week. The bullish mood moderated on Thursday as news came of increasing cases and deaths. Friday's doji pattern indicated uncertainty of the market's next move before the long weekend. Nevertheless, the NASDAQ ended the week with a strong 2.2% gain. 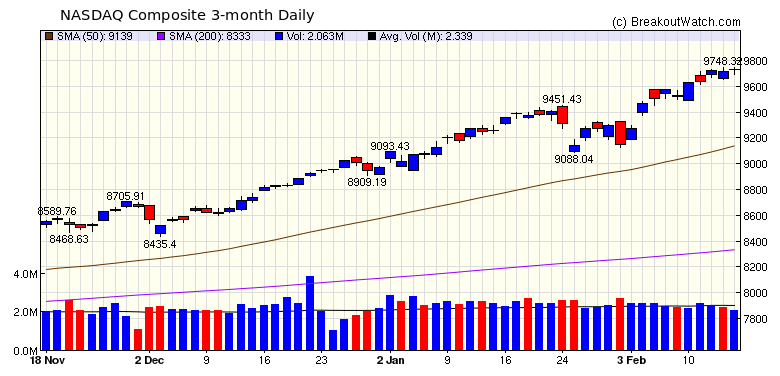 Breakout stocks had one of their
strongest weeks for some time with 15 cup and handle breakouts
averaging a 5.6% gain and 10 Volatility Squeeze breakouts
averaging a 5.5% gain
|
| This week I look at
a chart from Friday's Cup and Handle watchlist. I am not
suggesting you take a position in this stock, but it could be of
interest if an alert is issued on Tuesday (the markets are
closed on Monday). ALB formed a long cup during which it fell almost 50% from its Left Cup price but started to form the right side of its base i in November. Since then there has formed three handles and broke out from two of them on strong volume. The latest strong breakout on February 4 formed the pivot point of the current handle. The latest handle shows classic behavior with profit taking immediately after the breakout and then buyers returned and volume increased. Volume on Friday was 16% above average indicating that buyer interest is increasing.  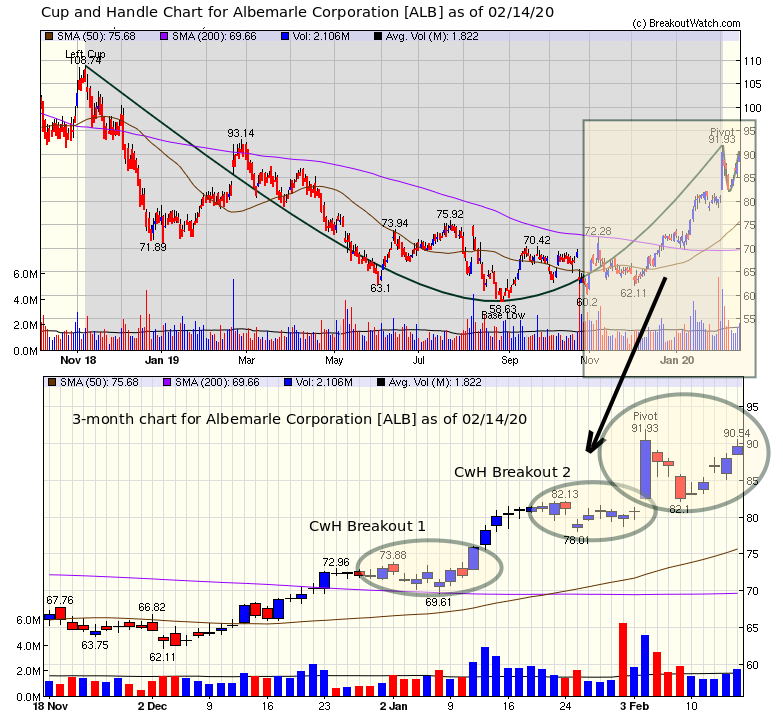 |
| No new features this week |
|
Our latest strategy
suggestions are here.
|
| List | Breakouts | Avg. Gain |
|---|---|---|
| CWH | 15 | 5.61 |
| SQZ | 10 | 5.46 |
| HTF | 0 | |
| HSB | 0 | |
| DB | 0 |
| Brkout Date | Symbol | Base | Squeeze | Brkout Price | Brkout Day Close | RS Rank* | Last Close | Current % off BOP | Gain at Intraday High |
|---|---|---|---|---|---|---|---|---|---|
| 2020-02-13 | SCPH | CWH | n | 7.00 | 7.33 | 95 | 8.64 | 23.43% | 24.86% |
| 2020-02-11 | AMBA | CWH | n | 65.23 | 67.45 | 89 | 71.52 | 9.64% | 12.82% |
| 2020-02-11 | PATK | CWH | n | 56.15 | 56.67 | 83 | 61.41 | 9.37% | 14.66% |
| 2020-02-13 | DAVA | CWH | y | 49.48 | 54.98 | 92 | 53.32 | 7.76% | 12.17% |
| 2020-02-11 | IRDM | CWH | n | 29.29 | 30.95 | 83 | 31.49 | 7.51% | 9.53% |
| 2020-02-12 | SWCH | SQZ | y | 16.46 | 17.05 | 89 | 17.4 | 5.71% | 8.31% |
| 2020-02-13 | SPAR | CWH | n | 19.17 | 20.27 | 95 | 20.21 | 5.43% | 7.98% |
| 2020-02-14 | NSTG | CWH | n | 32.00 | 33.7 | 86 | 33.7 | 5.31% | 5.94% |
| 2020-02-11 | AMT | SQZ | y | 243.70 | 254.27 | 84 | 256.25 | 5.15% | 6.12% |
| 2020-02-11 | CALX | CWH | n | 9.74 | 9.8 | 89 | 10.22 | 4.93% | 6.67% |
| 2020-02-11 | JKS | CWH | n | 24.36 | 25.74 | 87 | 25.5 | 4.68% | 18.06% |
| 2020-02-13 | XENT | CWH | n | 27.73 | 28.76 | 82 | 28.98 | 4.51% | 13.45% |
| 2020-02-14 | FTAI | SQZ | y | 20.10 | 20.62 | 88 | 20.62 | 2.59% | 2.89% |
| 2020-02-10 | ALNY | SQZ | y | 125.49 | 131.5 | 95 | 128.7 | 2.56% | 7.19% |
| 2020-02-10 | SNR | CWH | n | 8.03 | 8.07 | 84 | 8.23 | 2.49% | 3.11% |
| 2020-02-14 | MELI | CWH | n | 725.19 | 735.01 | 93 | 735.01 | 1.35% | 1.39% |
| 2020-02-11 | CNR | SQZ | y | 8.96 | 9.12 | 96 | 9.08 | 1.34% | 9.26% |
| 2020-02-13 | CSTL | SQZ | y | 31.48 | 31.73 | 87 | 31.8 | 1.02% | 2.83% |
| 2020-02-10 | PETS | CWH | n | 27.61 | 28.68 | 91 | 27.79 | 0.65% | 4.96% |
| 2020-02-13 | PACK | SQZ | y | 8.30 | 8.45 | 92 | 8.29 | -0.12% | 3.61% |
| 2020-02-13 | MKSI | CWH | n | 119.22 | 120.84 | 88 | 118.01 | -1.01% | 2.58% |
| 2020-02-12 | ECF | SQZ | y | 12.14 | 12.25 | 83 | 11.94 | -1.65% | 1.24% |
| 2020-02-11 | ELMD | CWH | y | 11.18 | 11.23 | 97 | 10.96 | -1.97% | 8.14% |
| 2020-02-12 | ARDX | SQZ | y | 7.44 | 7.8 | 98 | 7.2 | -3.23% | 8.87% |
| 2020-02-11 | NMIH | SQZ | y | 34.21 | 35.57 | 83 | 29.65 | -13.33% | 4.24% |
| *RS Rank on day before breakout. | |||||||||
| Symbol | BO Price |
BO Vol. |
Company | Industry | RS Rank |
Last Close |
|---|---|---|---|---|---|---|
| NLTX | 13.71 | 1,038,604 | Neoleukin Therapeutics - Inc. - Common Stock | Drug Manufacturers - Specialty & Generic | 99 | 11.06 |
| ARDX | 8.10 | 1,447,887 | Ardelyx - Inc. - Common Stock | Biotechnology | 98 | 7.20 |
| VGR | 13.86 | 1,682,811 | Vector Group Ltd. Common Stock | Tobacco | 89 | 13.38 |
| PRMW | 15.50 | 1,492,380 | Primo Water Corporation - Common Stock | Beverages - Non-Alcoholic | 88 | 15.31 |
| DDD | 12.49 | 2,793,544 | 3D Systems Corporation Common Stock | Computer Hardware | 88 | 11.80 |
| SLM | 12.09 | 6,484,112 | SLM Corporation - Common Stock | Credit Services | 88 | 12.06 |
| GFI | 6.83 | 8,434,162 | Gold Fields Limited American Depositary Shares | Gold | 87 | 6.10 |
| IBN | 15.42 | 9,147,297 | ICICI Bank Limited Common Stock | Banks - Regional | 87 | 15.09 |
| AMKR | 14.82 | 1,706,998 | Amkor Technology - Inc. - Common Stock | Semiconductors | 87 | 12.63 |
| HABT | 14.10 | 826,026 | The Habit Restaurants - Inc. - Class A Common Stock | Restaurants | 86 | 13.97 |
| These stocks meet our suggested screening factors
for our Cup and Handle Chart Pattern watchlist. See Revised Rules for Trading Cup and Handle Breakouts |
||||||
| Index | Value | Change Week | Change YTD | Trend1 |
|---|---|---|---|---|
| Dow | 29398.1 |
1.02% | 3.01% | Up |
| NASDAQ | 9731.18 |
2.21% | 8.45% | Up |
| S&P 500 | 3380.16 |
1.58% | 4.62% | Up |
|
1The Market Trend is derived from
our proprietary market model. The market model is described on
the site here.
2The site also shows industry rankings based on fundamentals, combined technical and fundamentals, and on price alone. The site also shows daily industry movements. |
||||
| 1 Week | 13 Weeks | 26 Weeks | Year-to-Date |
|---|---|---|---|
| NASDAQ Composite |
NASDAQ Composite 13.94 |
NASDAQ Composite 23.24 |
NASDAQ Composite 8.45 |
| 1 Week | 3 Weeks | 13 Weeks | 26 Weeks |
|---|---|---|---|
| Financial Data & Stock Exchanges |
| Financial Conglomerates 191 |
Financial Conglomerates 184 |
Gold 171 |
Closed-End Fund - Debt 189 |
| Charts of each industry rank and performance over 12 months are available on the site | |||
If you received this newsletter from a friend and you would like to receive it regularly please go to the BreakoutWatch.com site and you will then be able to register to receive the newsletter.
Copyright (c) 02/15/2020 NBIcharts, LLC dba BreakoutWatch.com. All
rights reserved.
" BreakoutWatch," the BreakoutWatch.com "eye" logo, and the slogan
"tomorrow's breakouts today" are service marks of NBIcharts LLC. All
other marks are the property of their respective owners, and are used
for descriptive purposes only.
BreakoutWatch is not affiliated with Investor's Business Daily or with Mr. William O'Neil. Our site, research and analysis is supported entirely by subscription and is free from advertising.