Breakoutwatch Weekly Summary 03/07/20
You are receiving this email because you are or were a BreakoutWatch.com subscriber, or have subscribed to our weekly newsletter. This newsletter summarizes the breakout events of the week and provides additional guidance that does not fit into our daily format. It is published each weekend.
| Market Trend Negative Despite
NASDAQ Flat Finish Despite huge gyrations in markets this week, the NASDAQ finished the week practically unchanged from last week's close. The index is testing support at the 200 day moving average level whereas the DJI and S&P 500 are already well below that psychological support level. Friday's strong economic report failed to prevent another sell-off a traders recognized that it was a view in the rear view mirror while there was darkness ahead. The markets recovered in the afternoon, perhaps in anticipation of an expected further rate cut at next week's FOMC meeting, but the NASDAQ was still down almost 2% at the close. 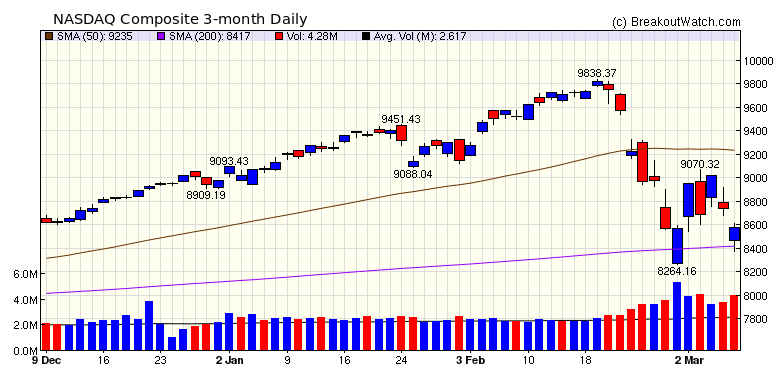 Big positive moves on Monday and
Wednesday did produce some rewarding breakouts
|
| Volatility
Squeeze Breakout AIH A filter for stocks under accumulation and with above average volume on the Volatility Squeeze watchlist on Monday 03/02 would have selected AIH. The strong price increase that day, coupled with well above average volume and accelerating momentum were an indication that AIH was a likely breakout the next day. We issued an alert at 09:35 and the stock went on to make a gain of 23% by Friday's close. 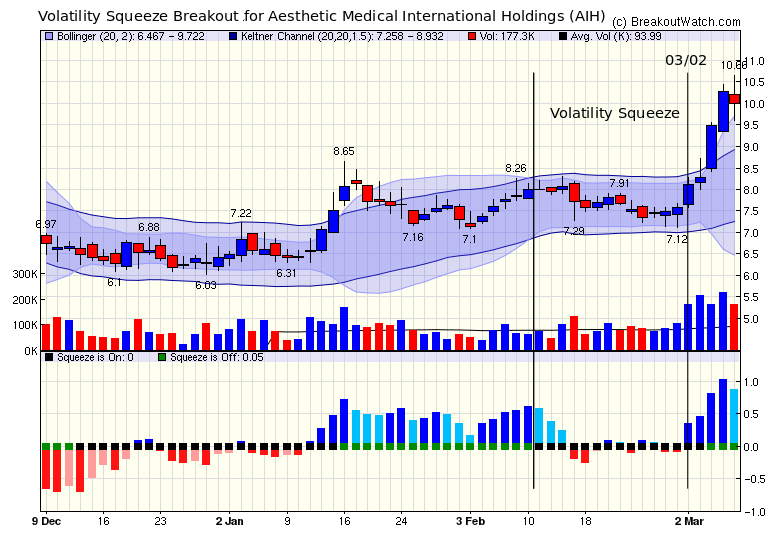 |
| No new features this week |
|
Our latest strategy
suggestions are here.
|
| List | Breakouts | Avg. Gain |
|---|---|---|
| CWH | 8 | 3.08 |
| SQZ | 3 | 8.27 |
| HTF | 0 | |
| HSB | 0 | |
| DB | 0 |
| Brkout Date | Symbol | Base | Squeeze | Brkout Price | Brkout Day Close | RS Rank* | Last Close | Current % off BOP | Gain at Intraday High |
|---|---|---|---|---|---|---|---|---|---|
| 2020-03-03 | AIH | SQZ | y | 8.13 | 8.27 | 89 | 10.01 | 23.12% | 31.09% |
| 2020-03-04 | ARCT | CWH | n | 15.65 | 16.78 | 97 | 18 | 15.02% | 21.41% |
| 2020-03-02 | LMNX | CWH | y | 25.79 | 26.36 | 87 | 27.4 | 6.24% | 13.42% |
| 2020-03-03 | IRTC | CWH | y | 91.93 | 95.39 | 81 | 95.72 | 4.12% | 13.4% |
| 2020-03-05 | APRE | SQZ | y | 35.42 | 36.26 | 93 | 36.34 | 2.6% | 6.27% |
| 2020-03-06 | BBN | CWH | n | 25.98 | 26.52 | 82 | 26.52 | 2.08% | 3.62% |
| 2020-03-04 | ETSY | CWH | n | 60.08 | 62.46 | 83 | 60.65 | 0.95% | 5.26% |
| 2020-03-04 | NET | CWH | n | 22.69 | 22.7 | 86 | 22.77 | 0.35% | 10.27% |
| 2020-03-06 | FAF | CWH | n | 66.40 | 66.49 | 86 | 66.49 | 0.14% | 0.57% |
| 2020-03-02 | RARX | SQZ | y | 46.77 | 46.97 | 96 | 46.35 | -0.9% | 0.81% |
| 2020-03-04 | NTRA | CWH | y | 40.00 | 40.17 | 94 | 38.29 | -4.28% | 4.5% |
| *RS Rank on day before breakout. | |||||||||
| date | symbol | list | support | close | gain % |
|---|---|---|---|---|---|
| 03/03/2020 | CORT | SS | 12.91 | 12.28 | 4.88 % |
| 03/03/2020 | LVGO | SS | 26.41 | 24.29 | 8.03 % |
| 03/03/2020 | MSFT | SS | 168.41 | 164.51 | 2.32 % |
| 03/03/2020 | HUBS | SS | 177.29 | 175.22 | 1.17 % |
| 03/05/2020 | PWR | SS | 40.16 | 39.12 | 2.59 % |
| 03/06/2020 | MCO | SS | 256.63 | 238.47 | 7.08 % |
| 03/06/2020 | ZTS | SS | 137.70 | 137.05 | 0.47 % |
| 03/06/2020 | CCK | SS | 74.91 | 73.11 | 2.4 % |
| 03/06/2020 | AMD | SS | 49.56 | 48.59 | 1.96 % |
| 03/06/2020 | OKTA | SS | 128.21 | 125.97 | 1.75 % |
| 03/06/2020 | DHI | SS | 57.18 | 54.8 | 4.16 % |
| 03/06/2020 | ACM | SS | 47.29 | 44.78 | 5.31 % |
| 03/06/2020 | AEP | SS | 98.34 | 97.7 | 0.65 % |
| 03/06/2020 | AKAM | SS | 93.55 | 90.62 | 3.13 % |
| 03/06/2020 | CHTR | SS | 510.42 | 496.72 | 2.68 % |
| 03/06/2020 | SPGI | SS | 289.47 | 271.06 | 6.36 % |
| 03/06/2020 | MSFT | SS | 169.08 | 161.57 | 4.44 % |
| Symbol | BO Price |
BO Vol. |
Company | Industry | RS Rank |
Last Close |
|---|---|---|---|---|---|---|
| SILV | 8.30 | 1,089,291 | SilverCrest Metals Inc. Common Shares | Other Industrial Metals & Mining | 95 | 6.97 |
| IOTS | 12.39 | 1,783,546 | Adesto Technologies Corporation - Common Stock | Semiconductors | 95 | 11.64 |
| UNIT | 11.08 | 4,269,128 | Uniti Group Inc. - Common Stock | REIT - Industrial | 92 | 9.58 |
| PRMW | 15.50 | 2,059,648 | Primo Water Corporation - Common Stock | Beverages - Non-Alcoholic | 91 | 15.09 |
| ELF | 20.00 | 1,291,378 | e.l.f. Beauty - Inc. Common Stock | Household & Personal Products | 91 | 15.65 |
| COOP | 14.68 | 752,700 | Mr. Cooper Group Inc. - Common Stock | Mortgage Finance | 83 | 11.43 |
| RESI | 12.86 | 970,263 | Front Yard Residential Corporation Common Stock | REIT - Residential | 82 | 12.49 |
| NDLS | 9.06 | 655,628 | Noodles & Company - Common Stock | Restaurants | 80 | 6.86 |
| These stocks meet our suggested screening factors
for our Cup and Handle Chart Pattern watchlist. See Revised Rules for Trading Cup and Handle Breakouts |
||||||
| Index | Value | Change Week | Change YTD | Trend1 |
|---|---|---|---|---|
| Dow | 25864.8 |
1.79% | -9.37% | Down |
| NASDAQ | 8575.62 |
0.1% | -4.42% | Down |
| S&P 500 | 2972.37 |
0.61% | -8% | Down |
|
1The Market Trend is derived from
our proprietary market model. The market model is described on
the site here.
2The site also shows industry rankings based on fundamentals, combined technical and fundamentals, and on price alone. The site also shows daily industry movements. |
||||
| 1 Week | 13 Weeks | 26 Weeks | Year-to-Date |
|---|---|---|---|
| Dow Jones |
NASDAQ Composite -0.93 |
NASDAQ Composite 5.83 |
NASDAQ Composite -4.42 |
| 1 Week | 3 Weeks | 13 Weeks | 26 Weeks |
|---|---|---|---|
| Medical Distribution |
Financial Data & Stock Exchanges |
| Grocery Stores 74 |
Solar 86 |
Gold 165 |
Closed-End Fund - Debt 199 |
| Charts of each industry rank and performance over 12 months are available on the site | |||
If you received this newsletter from a friend and you would like to receive it regularly please go to the BreakoutWatch.com site and you will then be able to register to receive the newsletter.
Copyright (c) 03/07/2020 NBIcharts, LLC dba BreakoutWatch.com. All
rights reserved.
" BreakoutWatch," the BreakoutWatch.com "eye" logo, and the slogan
"tomorrow's breakouts today" are service marks of NBIcharts LLC. All
other marks are the property of their respective owners, and are used
for descriptive purposes only.
BreakoutWatch is not affiliated with Investor's Business Daily or with Mr. William O'Neil. Our site, research and analysis is supported entirely by subscription and is free from advertising.