Breakoutwatch Weekly Summary 04/18/20
You are receiving this email because you are or were a BreakoutWatch.com subscriber, or have subscribed to our weekly newsletter. This newsletter summarizes the breakout events of the week and provides additional guidance that does not fit into our daily format. It is published each weekend.
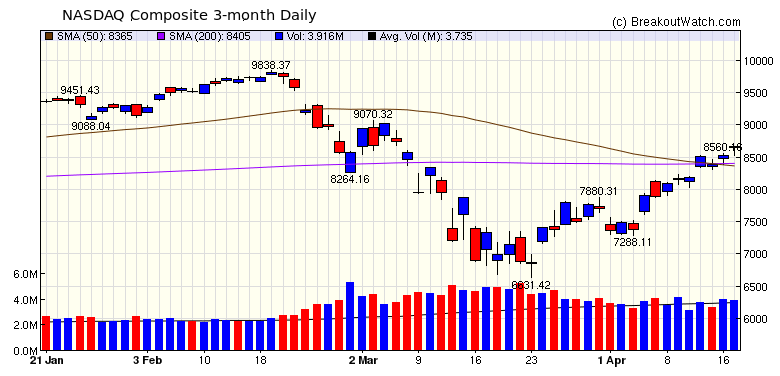
| Trend Signals are Positive for
Major Indexes Our NASDAQ Comp., DJI and S&P 500 trend signals turned positive this week. The NASDAQ is in the strongest position with the index being above both its 200 day and 50 day moving averages, but neither the DJI or S&P are in such a strong position. The strength of the rally is really quite surprising considering the state of the economy, and may represent an overly optimistic view that earnings will soon return to pre-covid levels. Consider this summary from briefing.com of the economic news this week:
 |
I applied my
preferred filter (above average volume and under accumulation)
to our cup and handle watchlist and found 4 stocks that met the
criteria. I then used the Chart Browser to examine the charts of
each and found the chart for NIC to be the most interesting. NIC
provides digital services to Federal, State and local
governments and was recently highlighted by IBD as a coronavirus
stock to watch.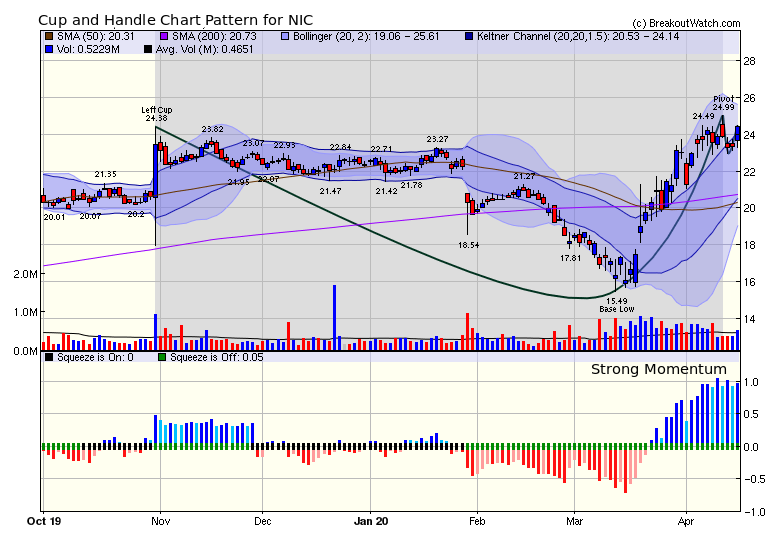 |
| No new features this week |
|
Our latest strategy
suggestions are here.
|
| List | Breakouts | Avg. Gain |
|---|---|---|
| CWH | 4 | 2.35 |
| SQZ | 4 | -0.97 |
| HTF | 0 | |
| HSB | 0 | |
| DB | 0 |
| Brkout Date | Symbol | Base | Squeeze | Brkout Price | Brkout Day Close | RS Rank* | Last Close | Current % off BOP | Gain at Intraday High |
|---|---|---|---|---|---|---|---|---|---|
| 2020-04-13 | FENC | SQZ | y | 6.47 | 7.23 | 95 | 6.99 | 8.04% | 23.49% |
| 2020-04-14 | QTS | CWH | n | 61.33 | 63.51 | 94 | 64.13 | 4.57% | 6.24% |
| 2020-04-16 | WERN | CWH | n | 39.23 | 39.35 | 91 | 40.11 | 2.24% | 3.21% |
| 2020-04-13 | CTSO | CWH | n | 7.73 | 8 | 96 | 7.84 | 1.42% | 21.6% |
| 2020-04-16 | SLGN | CWH | n | 32.66 | 33.4 | 89 | 33.04 | 1.16% | 3.97% |
| 2020-04-15 | ARCE | SQZ | y | 46.12 | 47.39 | 88 | 45.89 | -0.5% | 5.51% |
| 2020-04-15 | LAKE | SQZ | y | 16.51 | 17.2 | 96 | 16.12 | -2.36% | 9.02% |
| 2020-04-14 | STSA | SQZ | y | 19.29 | 20.04 | 96 | 17.54 | -9.07% | 8.86% |
| *RS Rank on day before breakout. | |||||||||
| Symbol | BO Price |
BO Vol. |
Company | Industry | RS Rank |
Last Close |
|---|---|---|---|---|---|---|
| FIT | 6.80 | 12,154,641 | Fitbit - Inc. Class A Common Stock | Scientific & Technical Instruments | 95 | 6.67 |
| EGO | 9.51 | 7,119,194 | Eldorado Gold Corporation Ordinary Shares | Gold | 94 | 8.31 |
| GFI | 7.43 | 15,220,576 | Gold Fields Limited American Depositary Shares | Gold | 93 | 6.35 |
| AGI | 7.60 | 6,075,838 | Alamos Gold Inc. Class A Common Shares | Gold | 92 | 6.38 |
| AQN | 14.53 | 1,704,741 | Algonquin Power & Utilities Corp. Common Shares | Utilities - Renewable | 89 | 14.10 |
| TEVA | 10.66 | 35,243,912 | Teva Pharmaceutical Industries Limited American De | Drug Manufacturers - Specialty & Generic | 89 | 10.27 |
| AKTS | 8.11 | 994,653 | Akoustis Technologies - Inc. - Common Stock | Communication Equipment | 86 | 7.56 |
| EQX | 8.05 | 1,906,204 | Equinox Gold Corp. Common Shares | Gold | 85 | 7.41 |
| These stocks meet our suggested screening factors
for our Cup and Handle Chart Pattern watchlist. See Revised Rules for Trading Cup and Handle Breakouts |
||||||
| Index | Value | Change Week | Change YTD | Trend1 |
|---|---|---|---|---|
| Dow | 24242.5 |
2.21% | -15.05% | Up |
| NASDAQ | 8650.14 |
6.09% | -3.59% | Up |
| S&P 500 | 2874.56 |
3.04% | -11.03% | Up |
|
1The Market Trend is derived from
our proprietary market model. The market model is described on
the site here.
2The site also shows industry rankings based on fundamentals, combined technical and fundamentals, and on price alone. The site also shows daily industry movements. |
||||
| 1 Week | 13 Weeks | 26 Weeks | Year-to-Date |
|---|---|---|---|
| NASDAQ Composite |
NASDAQ Composite -7.87 |
NASDAQ Composite 6.93 |
NASDAQ Composite -3.59 |
| 1 Week | 3 Weeks | 13 Weeks | 26 Weeks |
|---|---|---|---|
| Shell Companies |
Shell Companies |
| Other Precious Metals & Mining 82 |
Gold 110 |
Grocery Stores 198 |
Gold 187 |
| Charts of each industry rank and performance over 12 months are available on the site | |||
If you received this newsletter from a friend and you would like to receive it regularly please go to the BreakoutWatch.com site and you will then be able to register to receive the newsletter.
Copyright (c) 04/18/2020 NBIcharts, LLC dba BreakoutWatch.com. All
rights reserved.
" BreakoutWatch," the BreakoutWatch.com "eye" logo, and the slogan
"tomorrow's breakouts today" are service marks of NBIcharts LLC. All
other marks are the property of their respective owners, and are used
for descriptive purposes only.
BreakoutWatch is not affiliated with Investor's Business Daily or with Mr. William O'Neil. Our site, research and analysis is supported entirely by subscription and is free from advertising.