Breakoutwatch Weekly Summary 05/02/20
You are receiving this email because you are or were a
BreakoutWatch.com subscriber, or have subscribed to our weekly
newsletter. This newsletter summarizes the breakout events of the week
and provides additional guidance that does not fit into our daily
format. It is published each weekend.
Newsletter Archive: https://www.breakoutwatch.com/content/newsletters
| NASDAQ Retreats and Forms Cup and
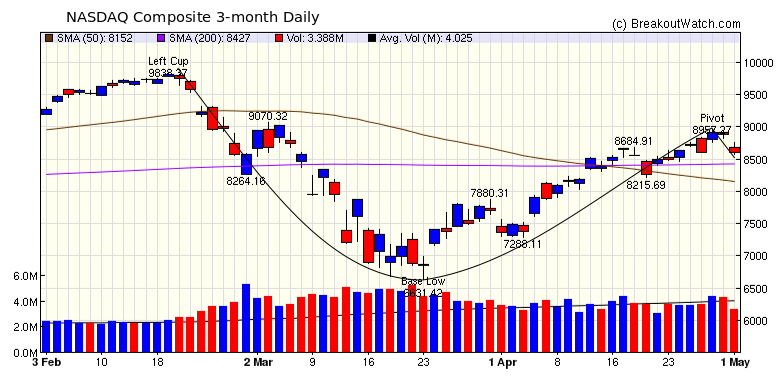
Handle Pattern Wednesday's market enthusiasm following the success of Remdesivir trials in shortening recovery times from Covid-19, was curtailed Thursday as the weekly jobs report showed a further 3.8 million workers had filed for unemployment assistance. The result was the NASDAQ gave up 0.3% and set up a handle with resistance at 8957. Our market signal remains positive for purely technical reasons although it is difficult to believe the underlying economy justifies the strength of the recent rally. Although there are baby steps being taken to reopen the economy in many states, airlines, hotels, and shopping malls are likely to remain depressed due to the fear of contagion. As long as unemployment remains high, consumption, which traditionally drives 70% of our GDP, will remain low.  The surge in the early part of the
week produced 14 breakouts but gains could not be sustained
following Thursday and Friday's declines.
|
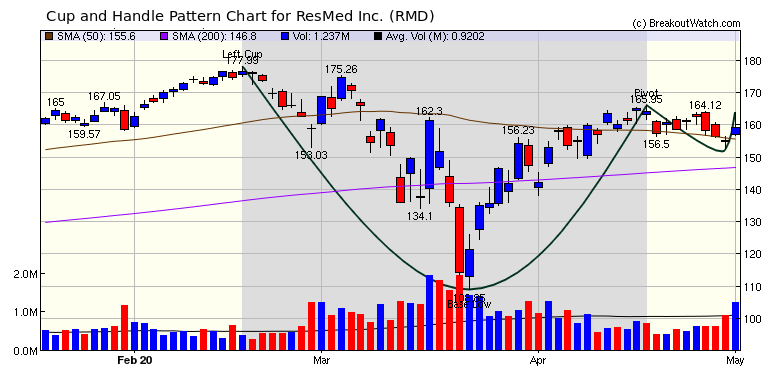
Ventilator
manufacturer Resmed Inc. surged on Friday following a 17%
increase in earnings. This surge could follow through on Monday
for a short term profit. |
| No new features this week |
|
Our latest strategy
suggestions are here.
|
| List | Breakouts | Avg. Gain |
|---|---|---|
| CWH | 9 | -4.42 |
| SQZ | 5 | 2.26 |
| HTF | 0 | |
| HSB | 0 | |
| DB | 0 |
| Brkout Date | Symbol | Base | Squeeze | Brkout Price | Brkout Day Close | RS Rank* | Last Close | Current % off BOP | Gain at Intraday High |
|---|---|---|---|---|---|---|---|---|---|
| 2020-04-27 | RLMD | SQZ | y | 36.06 | 37.67 | 88 | 39.4 | 9.26% | 21.94% |
| 2020-04-29 | ATRC | CWH | n | 40.76 | 41.39 | 92 | 43.56 | 6.87% | 7.61% |
| 2020-05-01 | GMAB | CWH | n | 24.60 | 25 | 89 | 25 | 1.63% | 2.03% |
| 2020-04-29 | GILD | SQZ | y | 78.68 | 83.14 | 93 | 79.95 | 1.61% | 8.88% |
| 2020-04-27 | AMSWA | SQZ | y | 15.73 | 16.43 | 89 | 15.91 | 1.14% | 14.75% |
| 2020-04-27 | STSA | SQZ | y | 18.23 | 19.69 | 92 | 18.28 | 0.27% | 11.68% |
| 2020-04-27 | RP | CWH | n | 62.12 | 62.92 | 80 | 62.26 | 0.23% | 5.71% |
| 2020-04-28 | PJT | SQZ | y | 47.47 | 50.82 | 90 | 47.01 | -0.97% | 14.3% |
| 2020-04-27 | SYRS | CWH | n | 8.85 | 8.94 | 92 | 8.45 | -4.52% | 1.69% |
| 2020-04-29 | STN | CWH | n | 29.83 | 30.39 | 90 | 28.43 | -4.69% | 3.15% |
| 2020-04-28 | DGICA | CWH | n | 15.28 | 15.39 | 88 | 14.46 | -5.37% | 5.96% |
| 2020-04-30 | AUPH | CWH | n | 17.00 | 17.24 | 98 | 15.69 | -7.71% | 5.76% |
| 2020-04-27 | GAIA | CWH | y | 9.89 | 10.16 | 94 | 8.85 | -10.52% | 4.75% |
| 2020-04-27 | DSSI | CWH | n | 14.49 | 14.55 | 88 | 12.22 | -15.67% | 6.97% |
| *RS Rank on day before breakout. | |||||||||
| Symbol | BO Price |
BO Vol. |
Company | Industry | RS Rank |
Last Close |
|---|---|---|---|---|---|---|
| APTO | 8.69 | 1,518,522 | Aptose Biosciences - Inc. - Common Shares | Biotechnology | 98 | 6.81 |
| VNET | 17.37 | 1,393,194 | 21Vianet Group - Inc. - American Depositary Shares | Information Technology Services | 97 | 14.11 |
| GCAP | 6.66 | 1,607,973 | GAIN Capital Holdings - Inc. Common Stock | Capital Markets | 96 | 6.25 |
| ARDX | 7.80 | 1,284,858 | Ardelyx - Inc. - Common Stock | Biotechnology | 96 | 6.44 |
| VSTO | 10.80 | 1,311,134 | Vista Outdoor Inc. Common Stock | Leisure | 95 | 9.84 |
| EGO | 10.19 | 7,320,430 | Eldorado Gold Corporation Ordinary Shares | Gold | 95 | 9.29 |
| SPWH | 7.80 | 1,335,897 | N/A | Leisure | 95 | 7.26 |
| CYTK | 16.56 | 1,365,928 | Cytokinetics - Incorporated - Common Stock | Biotechnology | 94 | 14.49 |
| FIT | 6.96 | 12,251,306 | Fitbit - Inc. Class A Common Stock | Scientific & Technical Instruments | 94 | 6.77 |
| CRK | 8.48 | 737,271 | Comstock Resources - Inc. Common Stock | Oil & Gas E&P | 93 | 7.46 |
| These stocks meet our suggested screening factors
for our Cup and Handle Chart Pattern watchlist. See Revised Rules for Trading Cup and Handle Breakouts |
||||||
| Index | Value | Change Week | Change YTD | Trend1 |
|---|---|---|---|---|
| Dow | 23723.7 |
-0.22% | -16.87% | Up |
| NASDAQ | 8604.95 |
-0.34% | -4.1% | Up |
| S&P 500 | 2830.71 |
-0.21% | -12.38% | Up |
|
1The Market Trend is derived from
our proprietary market model. The market model is described on
the site here.
2The site also shows industry rankings based on fundamentals, combined technical and fundamentals, and on price alone. The site also shows daily industry movements. |
||||
| 1 Week | 13 Weeks | 26 Weeks | Year-to-Date |
|---|---|---|---|
| S&P 500 |
NASDAQ Composite -5.97 |
NASDAQ Composite 2.61 |
NASDAQ Composite -4.1 |
| 1 Week | 3 Weeks | 13 Weeks | 26 Weeks |
|---|---|---|---|
| Shell Companies |
Shell Companies |
| Paper & Paper Products 39 |
Uranium 65 |
Uranium 133 |
Gold 194 |
| Charts of each industry rank and performance over 12 months are available on the site | |||
If you received this newsletter from a friend and you would like to receive it regularly please go to the BreakoutWatch.com site and you will then be able to register to receive the newsletter.
Copyright (c) 05/02/2020 NBIcharts, LLC dba BreakoutWatch.com. All
rights reserved.
" BreakoutWatch," the BreakoutWatch.com "eye" logo, and the slogan
"tomorrow's breakouts today" are service marks of NBIcharts LLC. All
other marks are the property of their respective owners, and are used
for descriptive purposes only.
BreakoutWatch is not affiliated with Investor's Business Daily or with Mr. William O'Neil. Our site, research and analysis is supported entirely by subscription and is free from advertising.