Breakoutwatch Weekly Summary 06/06/20
You are receiving this email because you are or were a
BreakoutWatch.com subscriber, or have subscribed to our weekly
newsletter. This newsletter summarizes the breakout events of the week
and provides additional guidance that does not fit into our daily
format. It is published each weekend.
Newsletter Archive: https://www.breakoutwatch.com/content/newsletters
| Breakouts Average 6.1% for the
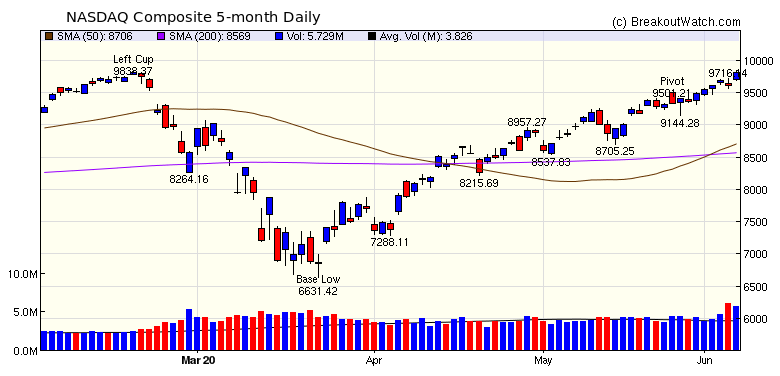
Week. NASDAQ Recovery Almost Complete. Confirmed breakouts averaged a 6.1% gain this week with Cup and Handle pattern breakouts delivering a 6.5% average gain above breakout price. The NASDAQ gained 3.4% for the week and closed just below its all-time high. Friday's job figures showing an unemployment rate of 13.3% caught analysts by surprise as the expectation was that the rate would climb to almost 20% (Briefing.com consensus 19.9%). The surprise caused the three major indexes to gap up at Friday's open and the DJI closed 3.2% higher while the NASDAQ lagged with a 2.1% gain. Overlooked in the rejoicing, was a footnote to the report identifying a misclassification error of around 3%. In the light of this, Monday may bring a reassessment of market values.  |
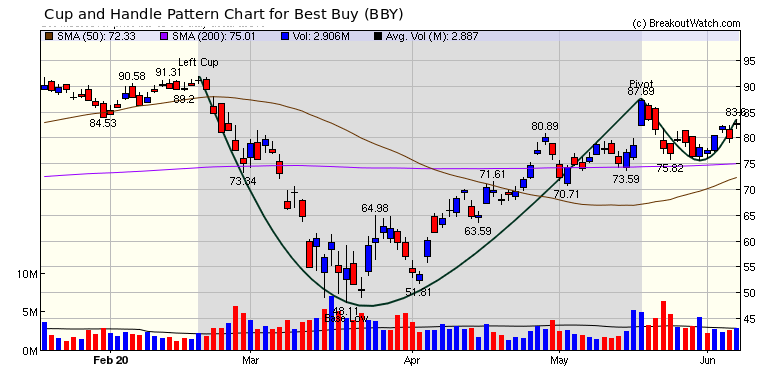
Best Buy (BBY) is
on Friday's Cup and Handle watchlist and is showing constructive
action in the handle since setting a pivot on March 18. The
handle is showing exactly the kind of behavior we expect prior
to a breakout (see Anatomy
of a Cup-with-Handle Chart Pattern), and is a stock to
watch in the near future. |
| No new features this week |
|
Our latest strategy
suggestions are here.
|
| List | Breakouts | Avg. Gain |
|---|---|---|
| CWH | 6 | 6.53 |
| SQZ | 13 | 5.95 |
| HTF | 0 | |
| HSB | 0 | |
| DB | 0 |
| Brkout Date | Symbol | Base | Squeeze | Brkout Price | Brkout Day Close | RS Rank* | Last Close | Current % off BOP | Gain at Intraday High |
|---|---|---|---|---|---|---|---|---|---|
| 2020-06-01 | LEU | CWH | n | 8.88 | 9.17 | 97 | 10.95 | 23.31% | 35.25% |
| 2020-06-02 | EFX | SQZ | y | 155.06 | 167.12 | 81 | 177.01 | 14.16% | 15.92% |
| 2020-06-01 | NLS | SQZ | y | 6.12 | 7.28 | 99 | 6.97 | 13.89% | 24.67% |
| 2020-06-02 | MTBC | SQZ | y | 6.72 | 7.4 | 91 | 7.44 | 10.71% | 15.94% |
| 2020-06-03 | STM | SQZ | y | 25.79 | 27.58 | 86 | 27.96 | 8.41% | 11.01% |
| 2020-06-05 | DVA | SQZ | y | 82.40 | 88.28 | 89 | 88.28 | 7.14% | 7.65% |
| 2020-06-02 | ARNA | CWH | n | 61.08 | 68.22 | 86 | 64.66 | 5.86% | 14.19% |
| 2020-06-03 | DMTK | SQZ | y | 13.30 | 13.64 | 87 | 14.07 | 5.79% | 7.14% |
| 2020-06-01 | EPAY | CWH | n | 51.17 | 53.36 | 82 | 54.02 | 5.57% | 8.07% |
| 2020-06-01 | HUBS | CWH | n | 200.78 | 213.22 | 82 | 211.76 | 5.47% | 8.77% |
| 2020-06-03 | STAA | SQZ | y | 41.01 | 43.05 | 90 | 43.18 | 5.29% | 9.41% |
| 2020-06-05 | BYSI | SQZ | y | 17.30 | 18.01 | 81 | 18.01 | 4.1% | 4.57% |
| 2020-06-01 | FRPT | SQZ | y | 77.19 | 84.49 | 92 | 80.05 | 3.71% | 12.77% |
| 2020-06-04 | DMTK | SQZ | y | 13.65 | 13.78 | 81 | 14.07 | 3.08% | 4.4% |
| 2020-06-02 | PSN | SQZ | y | 41.51 | 41.71 | 81 | 42.05 | 1.3% | 4.48% |
| 2020-06-05 | IEC | SQZ | y | 9.01 | 9.1 | 88 | 9.1 | 1% | 3.22% |
| 2020-06-01 | PING | CWH | y | 29.21 | 30.5 | 87 | 29.47 | 0.89% | 7.84% |
| 2020-06-01 | GHG | SQZ | y | 13.28 | 14.45 | 86 | 13.12 | -1.2% | 14.23% |
| 2020-06-02 | NICE | CWH | n | 188.38 | 188.86 | 85 | 184.73 | -1.94% | 1.66% |
| *RS Rank on day before breakout. | |||||||||
| Symbol | BO Price |
BO Vol. |
Company | Industry | RS Rank |
Last Close |
|---|---|---|---|---|---|---|
| APTO | 9.00 | 1,229,220 | Aptose Biosciences - Inc. - Common Shares | Biotechnology | 98 | 7.07 |
| OMI | 8.21 | 4,512,246 | Owens & Minor - Inc. Common Stock | Medical Distribution | 94 | 7.89 |
| OCUL | 7.63 | 1,323,524 | Ocular Therapeutix - Inc. - Common Stock | Biotechnology | 94 | 7.24 |
| AUPH | 18.72 | 1,808,667 | Aurinia Pharmaceuticals Inc - Common Shares | Biotechnology | 93 | 14.98 |
| SYRS | 10.76 | 517,934 | Syros Pharmaceuticals - Inc. - common stock | Biotechnology | 93 | 8.79 |
| ARDX | 8.33 | 1,048,494 | Ardelyx - Inc. - Common Stock | Biotechnology | 92 | 6.92 |
| CNSL | 7.04 | 813,164 | Consolidated Communications Holdings - Inc. - Commo | Telecom Services | 92 | 6.84 |
| TEVA | 13.23 | 22,116,776 | Teva Pharmaceutical Industries Limited American De | Drug Manufacturers - Specialty & Generic | 91 | 12.84 |
| GCAP | 6.72 | 897,016 | GAIN Capital Holdings - Inc. Common Stock | Capital Markets | 88 | 6.09 |
| IOTS | 12.22 | 792,048 | Adesto Technologies Corporation - Common Stock | Semiconductors | 87 | 11.93 |
| These stocks meet our suggested screening factors
for our Cup and Handle Chart Pattern watchlist. See Revised Rules for Trading Cup and Handle Breakouts |
||||||
| Index | Value | Change Week | Change YTD | Trend1 |
|---|---|---|---|---|
| Dow | 27111 |
6.81% | -5% | Up |
| NASDAQ | 9814.08 |
3.42% | 9.38% | Up |
| S&P 500 | 3193.93 |
4.91% | -1.14% | Up |
|
1The Market Trend is derived from
our proprietary market model. The market model is described on
the site here.
2The site also shows industry rankings based on fundamentals, combined technical and fundamentals, and on price alone. The site also shows daily industry movements. |
||||
| 1 Week | 13 Weeks | 26 Weeks | Year-to-Date |
|---|---|---|---|
| Dow Jones |
NASDAQ Composite 14.44 |
NASDAQ Composite 13.37 |
NASDAQ Composite 9.38 |
| 1 Week | 3 Weeks | 13 Weeks | 26 Weeks |
|---|---|---|---|
| Grocery Stores |
Shell Companies |
| Beverages - Wineries &
Distilleries 32 |
Airports & Air Services 50 |
Copper 117 |
Gold 195 |
| Charts of each industry rank and performance over 12 months are available on the site | |||
If you received this newsletter from a friend and you would like to receive it regularly please go to the BreakoutWatch.com site and you will then be able to register to receive the newsletter.
Copyright (c) 06/06/2020 NBIcharts, LLC dba BreakoutWatch.com. All
rights reserved.
" BreakoutWatch," the BreakoutWatch.com "eye" logo, and the slogan
"tomorrow's breakouts today" are service marks of NBIcharts LLC. All
other marks are the property of their respective owners, and are used
for descriptive purposes only.
BreakoutWatch is not affiliated with Investor's Business Daily or with Mr. William O'Neil. Our site, research and analysis is supported entirely by subscription and is free from advertising.