Breakoutwatch Weekly Summary 06/13/20
You are receiving this email because you are or were a
BreakoutWatch.com subscriber, or have subscribed to our weekly
newsletter. This newsletter summarizes the breakout events of the week
and provides additional guidance that does not fit into our daily
format. It is published each weekend.
Newsletter Archive: https://www.breakoutwatch.com/content/newsletters
| Number of Breakouts Falls as
Markets Consolidate The NASDAQ slipped 2.3% this week after reaching a new all time high on Wednesday. The new high was followed by a sharp sell-off on Thursday with the NASDAQ dropping 9%. Friday saw a modest recovery of just 1%. The reason for Thursday's rout was unclear with some analysts blaming the Fed for Wednesday's announcement that full employment wouldn't return until 2022, while others blamed the accelerating clovid-19 cases in several states. What could not be doubted is that the markets were over extended and it was time for a bout of consolidation. Friday's modest recovery came on less than average volume and could perhaps be attributed to the current 'buy the dip' mentality. Realistically, a fall to the 9250 support level is possible. 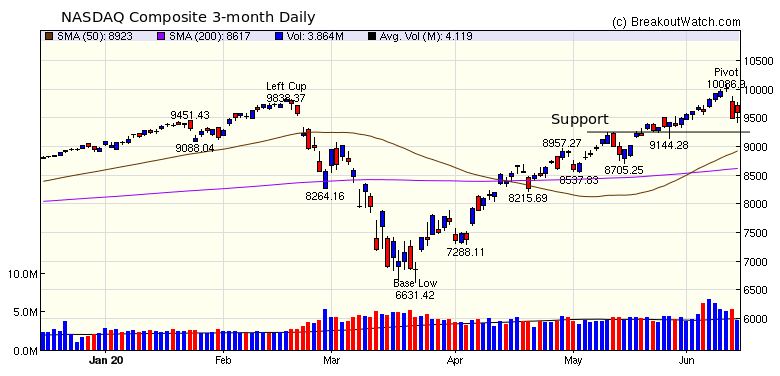 There was only one breakout from a
cup and handle pattern this week while 5 from a Volatility
Squeeze pattern were all under water at Friday's close.
|
This week's chart
is taken from Friday's Cup and Handle watchlist. It is
GlobalScape Inc (GSB). This stock broke out of a Volatility
Squeeze pattern on June 3 although volume didn't meet our 1.5
times ADV requirement to be recognized officially as a breakout.
It then set a new pivot on Monday of this week and has since
formed a classic handle with a strong move up on Friday on more
than 2 times ADV. While not recommending GSB as a buy, I think
it is worth monitoring on Monday.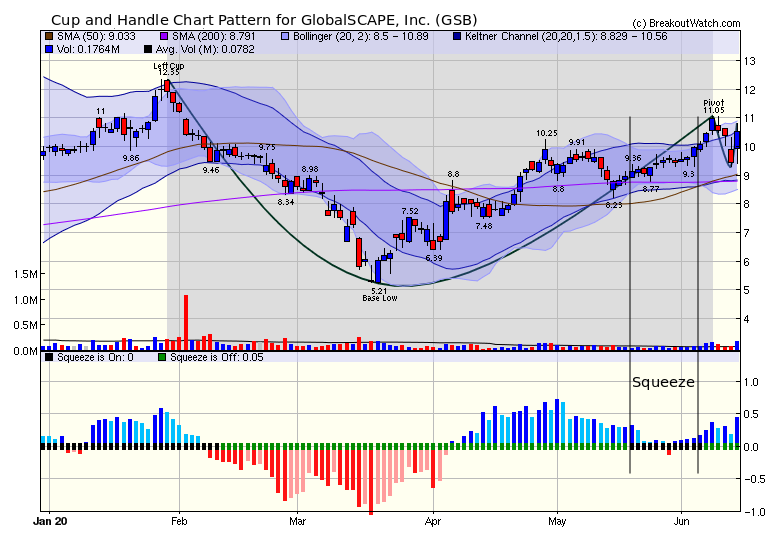 |
| No new features this week |
|
Our latest strategy
suggestions are here.
|
| List | Breakouts | Avg. Gain |
|---|---|---|
| CWH | 1 | 0.28 |
| SQZ | 5 | -0.89 |
| HTF | 0 | |
| HSB | 0 | |
| DB | 0 |
| Brkout Date | Symbol | Base | Squeeze | Brkout Price | Brkout Day Close | RS Rank* | Last Close | Current % off BOP | Gain at Intraday High |
|---|---|---|---|---|---|---|---|---|---|
| 2020-06-08 | DL | SQZ | y | 7.23 | 8.22 | 82 | 8.61 | 19.09% | 19.92% |
| 2020-06-08 | SRPT | CWH | n | 158.40 | 159.68 | 90 | 158.85 | 0.28% | 2.55% |
| 2020-06-08 | SPRO | SQZ | y | 12.45 | 13.32 | 86 | 11.95 | -4.02% | 9.8% |
| 2020-06-08 | MIRM | SQZ | y | 18.51 | 18.96 | 94 | 17.65 | -4.65% | 4.32% |
| 2020-06-09 | NLTX | SQZ | y | 13.70 | 14.95 | 99 | 12.8 | -6.57% | 12.04% |
| 2020-06-08 | PSN | SQZ | y | 42.06 | 42.71 | 81 | 38.57 | -8.3% | 2.09% |
| *RS Rank on day before breakout. | |||||||||
| Symbol | BO Price |
BO Vol. |
Company | Industry | RS Rank |
Last Close |
|---|---|---|---|---|---|---|
| BLDP | 14.63 | 3,255,255 | Ballard Power Systems - Inc. - Common Shares | Specialty Industrial Machinery | 97 | 13.39 |
| BCLI | 9.63 | 696,729 | Brainstorm Cell Therapeutics Inc. - Common Stock | Biotechnology | 96 | 8.47 |
| CBB | 14.98 | 1,198,368 | Cincinnati Bell Inc. Common Stock | Telecom Services | 95 | 14.75 |
| OCUL | 8.01 | 1,332,458 | Ocular Therapeutix - Inc. - Common Stock | Biotechnology | 95 | 7.45 |
| OMI | 9.14 | 3,660,226 | Owens & Minor - Inc. Common Stock | Medical Distribution | 94 | 7.29 |
| AUPH | 18.72 | 1,765,004 | Aurinia Pharmaceuticals Inc - Common Shares | Biotechnology | 93 | 15.51 |
| SYRS | 10.76 | 525,398 | Syros Pharmaceuticals - Inc. - common stock | Biotechnology | 93 | 8.85 |
| VIPS | 18.34 | 10,437,603 | Vipshop Holdings Limited American Depositary Share | Internet Retail | 92 | 17.72 |
| EQT | 16.90 | 12,354,471 | EQT Corporation Common Stock | Oil & Gas E&P | 92 | 14.81 |
| DB | 10.40 | 9,595,688 | Deutsche Bank AG Common Stock | Banks - Regional | 89 | 9.39 |
| These stocks meet our suggested screening factors
for our Cup and Handle Chart Pattern watchlist. See Revised Rules for Trading Cup and Handle Breakouts |
||||||
| Index | Value | Change Week | Change YTD | Trend1 |
|---|---|---|---|---|
| Dow | 25605.5 |
-5.55% | -10.28% | Up |
| NASDAQ | 9588.81 |
-2.3% | 6.87% | Up |
| S&P 500 | 3041.31 |
-4.78% | -5.86% | Up |
|
1The Market Trend is derived from
our proprietary market model. The market model is described on
the site here.
2The site also shows industry rankings based on fundamentals, combined technical and fundamentals, and on price alone. The site also shows daily industry movements. |
||||
| 1 Week | 13 Weeks | 26 Weeks | Year-to-Date |
|---|---|---|---|
| NASDAQ Composite |
NASDAQ Composite 21.76 |
NASDAQ Composite 9.78 |
NASDAQ Composite 6.87 |
| 1 Week | 3 Weeks | 13 Weeks | 26 Weeks |
|---|---|---|---|
| Silver |
Shell Companies |
| Education & Training Services 24 |
Copper 41 |
Silver 133 |
Gold 200 |
| Charts of each industry rank and performance over 12 months are available on the site | |||
If you received this newsletter from a friend and you would like to receive it regularly please go to the BreakoutWatch.com site and you will then be able to register to receive the newsletter.
Copyright (c) 06/13/2020 NBIcharts, LLC dba BreakoutWatch.com. All
rights reserved.
" BreakoutWatch," the BreakoutWatch.com "eye" logo, and the slogan
"tomorrow's breakouts today" are service marks of NBIcharts LLC. All
other marks are the property of their respective owners, and are used
for descriptive purposes only.
BreakoutWatch is not affiliated with Investor's Business Daily or with Mr. William O'Neil. Our site, research and analysis is supported entirely by subscription and is free from advertising.