Breakoutwatch Weekly Summary 07/11/20
You are receiving this email because you are or were a
BreakoutWatch.com subscriber, or have subscribed to our weekly
newsletter. This newsletter summarizes the breakout events of the week
and provides additional guidance that does not fit into our daily
format. It is published each weekend.
Newsletter Archive: https://www.breakoutwatch.com/content/newsletters
| New Buy at Open and Buy on Alert
Guidelines (see Strategy Suggestions) The NASDAQ continued to power ahead with a gain of 4% this week, setting another new high on Thursday. The index slipped slightly on Friday as volume sagged as traders took the afternoon off. The S&P 500 and DJI also gained although at a smaller rate. Significantly though, the small-cap Russell 2000 slipped 0.5% indicating the lower prospects for smaller business in this challenging economy. 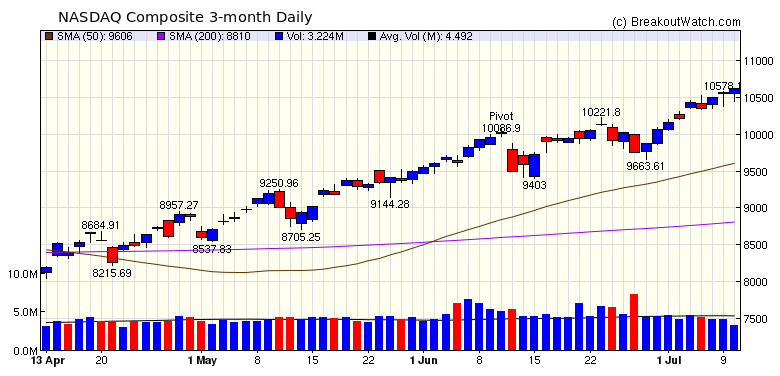 |
There were no
stocks on the latest Cup and Handle Pattern watchlist that meet
all the criteria to buy on alert on Monday. All of them failed
to meet the 1.25 times ADV criteria. Lakeland Industries
is a PPE manufacturer with an RS Rank of 95. Although this may
not be a buy on Monday, we are hearing of serious shortages of
PPE arising again, so it could be one to watch.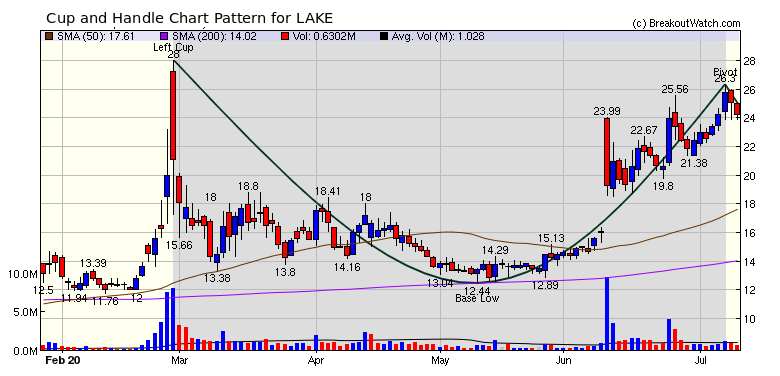 |
| No new features this week |
|
I have spent some time
this week using the cup and handle backtest tool to look at
which stocks have performed best in the current bull market.
This has led me to seriously revise the Buy at Open and Buy on
Alert strategies. Time hasn't allowed me to completely rewrite
the Strategy Suggestions page, which I will try to update in
the coming week.
Most significantly, I have found
that whereas the previous guidelines suggested a maximum BoP
of $20 and minimum volume, these limitations must be raised.
This is perhaps not surprising in this bull market where
Government support has flowed to the bigger, more expensive,
companies which are the most likely to survive a prolonged
downturn. Similarly, it is the companies with the best
performance compared to their peers that do best.
If using the Buy at Open
strategy, there is risk that overnight sell orders to take
profits will have been entered. The backtest showed that stock
with an RS Rank of 90 were less prone to this.Hence the
minimum RS Rank to buy has risen to 90%, limiting candidate
stocks to 10% of the overall market. For the Buy on Alert
strategy there is not the same risk and RS Rank stocks greater
than 80 gave the best performance.
The table below shows the
characteristics required to generate the best returns (as
revealed by the backtest tool) since April 1, the approximate
confirmed start of the bull market. The table also contains a
link to an image of the backtest results. I have set the
default parameters for the backtest to these parameters.
* Setting the number of positions
to 1 in the backtest allocates all available cash to the
current buy. This maximizes the return calculated by the tool.
You can experiment with other less aggressive options in the
tool.
** The Upper ATR value is
obtained from Analytical Tools > Trailing Stop Calculator.
The Trailing Stop volume must be given to your broker each day
before market open.
|
| List | Breakouts | Avg. Gain |
|---|---|---|
| CWH | 6 | 7.21 |
| SQZ | 3 | 0.13 |
| HTF | 3 | 1.04 |
| HSB | 0 | |
| DB | 0 |
| Brkout Date | Symbol | Base | Squeeze | Brkout Price | Brkout Day Close | RS Rank* | Last Close | Current % off BOP | Gain at Intraday High |
|---|---|---|---|---|---|---|---|---|---|
| 2020-07-06 | BABA | CWH | y | 231.03 | 240 | 81 | 261.01 | 12.98% | 16% |
| 2020-07-09 | ROKU | CWH | n | 135.87 | 149.69 | 82 | 153.05 | 12.64% | 17.65% |
| 2020-07-08 | EVSI | CWH | n | 10.75 | 12.21 | 93 | 11.59 | 7.81% | 15.35% |
| 2020-07-07 | LGIH | HTF | y | 95.24 | 97.67 | 90 | 101.61 | 6.69% | 8.73% |
| 2020-07-06 | EDU | CWH | y | 141.37 | 143.84 | 84 | 148.39 | 4.97% | 5.22% |
| 2020-07-08 | DDOG | HTF | n | 93.00 | 96.13 | 96 | 96.41 | 3.67% | 6.43% |
| 2020-07-07 | ALNY | CWH | n | 158.37 | 160 | 90 | 162.25 | 2.45% | 3.61% |
| 2020-07-07 | GRBK | CWH | y | 12.40 | 12.65 | 83 | 12.7 | 2.42% | 6.69% |
| 2020-07-06 | EVBG | SQZ | y | 146.50 | 147.37 | 95 | 147.18 | 0.46% | 4.99% |
| 2020-07-08 | GRBK | SQZ | y | 12.66 | 12.91 | 86 | 12.7 | 0.32% | 4.5% |
| 2020-07-09 | FTNT | SQZ | y | 146.36 | 149.6 | 89 | 145.8 | -0.38% | 3.82% |
| 2020-07-06 | MCFT | HTF | n | 19.99 | 20.6 | 82 | 18.54 | -7.25% | 4.1% |
| *RS Rank on day before breakout. | |||||||||
| Symbol | BO Price |
BO Vol. |
Company | Industry | RS Rank |
Last Close |
|---|---|---|---|---|---|---|
| AKBA | 13.70 | 2,884,791 | Akebia Therapeutics - Inc. | Biotechnology | 96 | 11.98 |
| CBB | 14.98 | 1,013,248 | Cinci | Telecom Services | 95 | 14.90 |
| CTSO | 10.48 | 814,346 | Cytosorbents Corporation | Medical Devices | 94 | 10.14 |
| CVM | 17.10 | 1,209,870 | Ce | Biotechnology | 89 | 14.30 |
| RAD | 18.64 | 6,115,311 | Rite Aid Corporation | Pharmaceutical Retailers | 88 | 16.21 |
| CNSL | 7.26 | 714,969 | Consolidated Communications Holdings - Inc. | Telecom Services | 85 | 6.23 |
| UNIT | 9.75 | 2,986,686 | Uniti Group Inc. | REIT - Industrial | 85 | 9.24 |
| MEET | 6.26 | 1,898,994 | The Meet Group - Inc. | Internet Content & Information | 83 | 6.24 |
| BITA | 15.95 | 994,388 | Bitauto Holdings Limited | Advertising Agencies | 82 | 15.86 |
| SY | 16.06 | 1,155,123 | So-Young International Inc. | Health Information Services | 81 | 14.12 |
| These stocks meet our suggested screening factors
for our Cup and Handle Chart Pattern watchlist. See Revised Rules for Trading Cup and Handle Breakouts |
||||||
| Index | Value | Change Week | Change YTD | Trend1 |
|---|---|---|---|---|
| Dow | 26075.3 |
0.96% | -8.63% | Up |
| NASDAQ | 10617.4 |
4.01% | 18.33% | Up |
| S&P 500 | 3185.04 |
1.76% | -1.42% | Up |
|
1The Market Trend is derived from
our proprietary market model. The market model is described on
the site here.
2The site also shows industry rankings based on fundamentals, combined technical and fundamentals, and on price alone. The site also shows daily industry movements. |
||||
| 1 Week | 13 Weeks | 26 Weeks | Year-to-Date |
|---|---|---|---|
| NASDAQ Composite |
NASDAQ Composite 29.6 |
NASDAQ Composite 15.67 |
NASDAQ Composite 18.33 |
| 1 Week | 3 Weeks | 13 Weeks | 26 Weeks |
|---|---|---|---|
| Silver |
Grocery Stores |
| Aluminum 50 |
Aluminum 57 |
Recreational Vehicles 102 |
Gold 200 |
| Charts of each industry rank and performance over 12 months are available on the site | |||
If you received this newsletter from a friend and you would like to receive it regularly please go to the BreakoutWatch.com site and you will then be able to register to receive the newsletter.
Copyright (c) 07/11/2020 NBIcharts, LLC dba BreakoutWatch.com. All
rights reserved.
" BreakoutWatch," the BreakoutWatch.com "eye" logo, and the slogan
"tomorrow's breakouts today" are service marks of NBIcharts LLC. All
other marks are the property of their respective owners, and are used
for descriptive purposes only.
BreakoutWatch is not affiliated with Investor's Business Daily or with Mr. William O'Neil. Our site, research and analysis is supported entirely by subscription and is free from advertising.