Breakoutwatch Weekly Summary 07/25/20
You are receiving this email because you are or were a
BreakoutWatch.com subscriber, or have subscribed to our weekly
newsletter. This newsletter summarizes the breakout events of the week
and provides additional guidance that does not fit into our daily
format. It is published each weekend.
Newsletter Archive: https://www.breakoutwatch.com/content/newsletters
| Market Trends Still Positive, but
for How Long? The three major indexes retreated this week, with the NASDAQ sustaining its second consecutive weekly loss. Technology stocks led the NASDAQ lower after the week began with Microsoft (MSFT) and Tesla (TSLA) reporting better than expected earnings, but fears that the mega-caps still to report, Apple (AAPL), Amazon (AMZN), Alphabet (GOOG), and Facebook (FB), may not match their performance, took the index down. Overall, the economy is showing a mixed performance with home sales and construction rising due to lower mortgage rates, but an increase in unemployment as Covid-19 ravages the south and west will put further pressure on small businesses.Furthermore a wave of rent defaults and evictions will create more homeless, and hurt landlords and banks. The NASDAQ may test its 50 day moving average in the near future, but with low bond yields and gold at its highest price ever, where else can investors put their money, other than in the stock market. 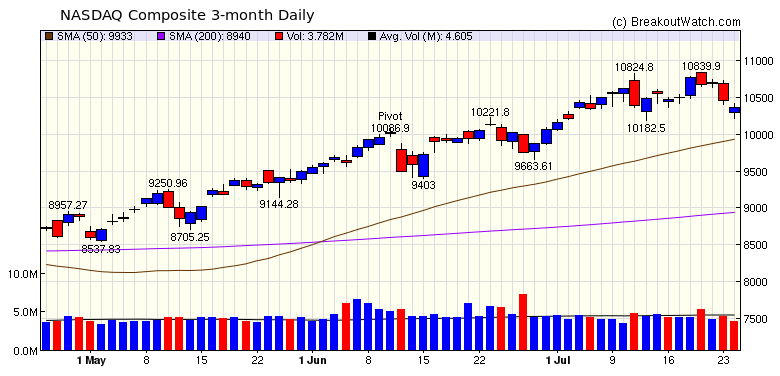 |
| With the Volatility
Squeeze pattern performing well over the last week with an
average gain of 5.4%, this week we look at the most likely
breakout from that pattern from Friday's watchlist. Food Distributor, SpartanNash (SPTN) broke out from a cup and handle pattern on 7/21, but has moved sideways since then and is in a Volatility Squeeze pattern. Momentum has been strong, although volumes have been below the 50 day moving average. SPTN ranks second in the Food Distribution industry with an RS rank of 91, which puts it in the top 10% price performance of all companies over the last 12 months. 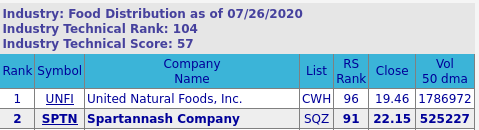 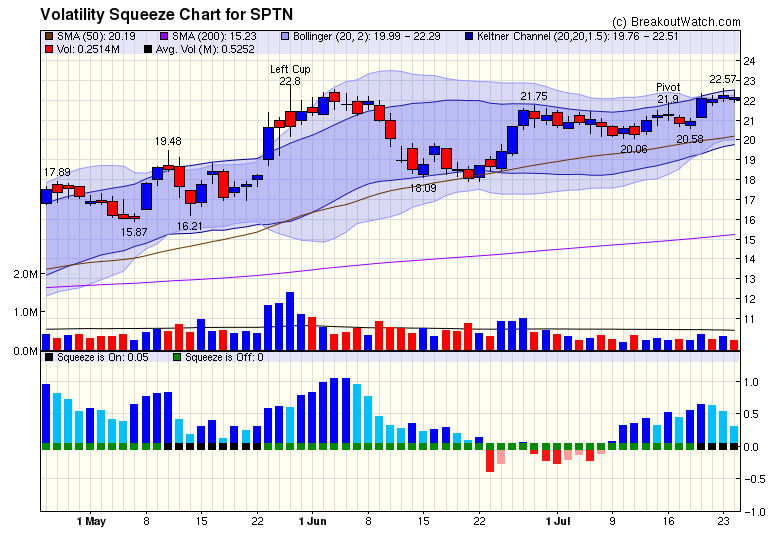 |
| No new features this week |
|
Our latest strategy
suggestions are here.
|
| List | Breakouts | Avg. Gain |
|---|---|---|
| CWH | 5 | -3.04 |
| SQZ | 14 | 5.41 |
| HTF | 5 | -0.36 |
| HSB | 0 | |
| DB | 0 |
| Brkout Date | Symbol | Base | Squeeze | Brkout Price | Brkout Day Close | RS Rank* | Last Close | Current % off BOP | Gain at Intraday High |
|---|---|---|---|---|---|---|---|---|---|
| 2020-07-24 | WKEY | SQZ | y | 7.09 | 9.5 | 91 | 9.5 | 33.99% | 33.99% |
| 2020-07-22 | MWK | SQZ | y | 6.22 | 6.9 | 89 | 7.51 | 20.74% | 30.87% |
| 2020-07-20 | LEU | SQZ | y | 11.19 | 12.16 | 96 | 13.51 | 20.73% | 26.36% |
| 2020-07-22 | DLHC | SQZ | y | 7.84 | 8.83 | 90 | 8.87 | 13.14% | 18.62% |
| 2020-07-21 | MBUU | SQZ | y | 53.13 | 57.17 | 92 | 58.98 | 11.01% | 13.8% |
| 2020-07-20 | JMIA | HTF | n | 8.94 | 9.33 | 84 | 9.49 | 6.15% | 20.81% |
| 2020-07-20 | EXPI | HTF | n | 17.61 | 17.67 | 94 | 18.59 | 5.57% | 20.51% |
| 2020-07-21 | MCFT | HTF | y | 20.81 | 22.06 | 93 | 21.55 | 3.56% | 11% |
| 2020-07-22 | MBUU | SQZ | y | 57.18 | 59.07 | 93 | 58.98 | 3.15% | 5.74% |
| 2020-07-21 | TXG | SQZ | y | 93.01 | 95.21 | 84 | 94.65 | 1.76% | 4.15% |
| 2020-07-21 | HSKA | SQZ | y | 96.15 | 96.96 | 81 | 97.63 | 1.54% | 5.27% |
| 2020-07-21 | SFM | CWH | n | 26.50 | 27.41 | 84 | 26.605 | 0.4% | 5.64% |
| 2020-07-21 | UNIT | CWH | n | 9.75 | 10.01 | 88 | 9.77 | 0.21% | 5.74% |
| 2020-07-22 | LOVE | SQZ | y | 28.77 | 30.41 | 95 | 28.72 | -0.17% | 11.23% |
| 2020-07-23 | PRSC | CWH | y | 81.06 | 82.18 | 84 | 80.76 | -0.37% | 3.52% |
| 2020-07-21 | GRWG | SQZ | y | 7.40 | 7.84 | 92 | 7.26 | -1.89% | 14.59% |
| 2020-07-21 | OPRT | HTF | y | 14.17 | 14.26 | 86 | 13.68 | -3.46% | 3.03% |
| 2020-07-22 | AHPI | SQZ | y | 11.54 | 12.89 | 99 | 11.1 | -3.81% | 14.99% |
| 2020-07-21 | XBIT | CWH | n | 16.04 | 16.08 | 84 | 15.24 | -4.99% | 16.65% |
| 2020-07-22 | XBIT | SQZ | y | 16.09 | 17.54 | 85 | 15.24 | -5.28% | 16.28% |
| 2020-07-23 | CSBR | SQZ | y | 9.97 | 10.2 | 84 | 9.32 | -6.52% | 9.23% |
| 2020-07-20 | ASMB | CWH | y | 25.42 | 27.04 | 89 | 22.76 | -10.46% | 9.52% |
| 2020-07-20 | DNLI | SQZ | y | 26.49 | 28.25 | 85 | 23.13 | -12.68% | 9.51% |
| 2020-07-20 | NK | HTF | n | 15.33 | 15.36 | 99 | 13.24 | -13.63% | 2.41% |
| *RS Rank on day before breakout. | |||||||||
| Symbol | BO Price |
BO Vol. |
Company | Industry | RS Rank |
Last Close |
|---|---|---|---|---|---|---|
| AKBA | 13.70 | 1,996,587 | Akebia Therapeutics - Inc. | Biotechnology | 95 | 11.76 |
| CBB | 14.98 | 877,076 | Cinci | Telecom Services | 95 | 14.92 |
| PSTI | 9.88 | 993,054 | Pluristem Therapeutics - Inc. | Biotechnology | 90 | 8.55 |
| RAD | 18.64 | 5,866,672 | Rite Aid Corporation | Pharmaceutical Retailers | 89 | 15.11 |
| CTSO | 11.74 | 880,762 | Cytosorbents Corporation | Medical Devices | 89 | 9.78 |
| UNIT | 10.31 | 2,758,806 | Uniti Group Inc. | REIT - Industrial | 87 | 9.77 |
| GLUU | 10.84 | 6,574,185 | Glu Mobile Inc. | Electronic Gaming & Multimedia | 83 | 9.14 |
| INFY | 12.63 | 17,301,884 | Infosys Limited American | Information Technology Services | 83 | 12.33 |
| MEET | 6.30 | 1,815,266 | The Meet Group - Inc. | Internet Content & Information | 81 | 6.23 |
| These stocks meet our suggested screening factors
for our Cup and Handle Chart Pattern watchlist. See Revised Rules for Trading Cup and Handle Breakouts |
||||||
| Index | Value | Change Week | Change YTD | Trend1 |
|---|---|---|---|---|
| Dow | 26469.9 |
-0.76% | -7.25% | Up |
| NASDAQ | 10363.2 |
-1.33% | 15.5% | Up |
| S&P 500 | 3215.63 |
-0.28% | -0.47% | Up |
|
1The Market Trend is derived from
our proprietary market model. The market model is described on
the site here.
2The site also shows industry rankings based on fundamentals, combined technical and fundamentals, and on price alone. The site also shows daily industry movements. |
||||
| 1 Week | 13 Weeks | 26 Weeks | Year-to-Date |
|---|---|---|---|
| S&P 500 |
NASDAQ Composite 20.02 |
NASDAQ Composite 11.25 |
NASDAQ Composite 15.5 |
| 1 Week | 3 Weeks | 13 Weeks | 26 Weeks |
|---|---|---|---|
| Silver |
Silver |
| Other Precious Metals & Mining 35 |
Aluminum 67 |
Residential Construction 103 |
Uranium 128 |
| Charts of each industry rank and performance over 12 months are available on the site | |||
If you received this newsletter from a friend and you would like to receive it regularly please go to the BreakoutWatch.com site and you will then be able to register to receive the newsletter.
Copyright (c) 07/25/2020 NBIcharts, LLC dba BreakoutWatch.com. All
rights reserved.
" BreakoutWatch," the BreakoutWatch.com "eye" logo, and the slogan
"tomorrow's breakouts today" are service marks of NBIcharts LLC. All
other marks are the property of their respective owners, and are used
for descriptive purposes only.
BreakoutWatch is not affiliated with Investor's Business Daily or with Mr. William O'Neil. Our site, research and analysis is supported entirely by subscription and is free from advertising.