Breakoutwatch Weekly Summary 08/01/20
You are receiving this email because you are or were a
BreakoutWatch.com subscriber, or have subscribed to our weekly
newsletter. This newsletter summarizes the breakout events of the week
and provides additional guidance that does not fit into our daily
format. It is published each weekend.
Newsletter Archive: https://www.breakoutwatch.com/content/newsletters
| Breakouts Average 5% Gain as NASDAQ
Advances 3.7%. Cup and Handle Pattern Breakouts Dominate The NASDAQ shrugged off last week's ominous looking decline to gain 3.7% bolstered by better than expected Q2 results from Apple (AAPL), Amazon (AMZN), Alphabet (GOOG), and Facebook (FB). Because the NASDAQ Composite is a market capitalization-weighted index, these stocks have a heavy influence on the daily movement of the index. Should they fall out of favor, then the index will move south. At the moment, there seems little fear of that happening,unless serious anti-trust action is threatened. 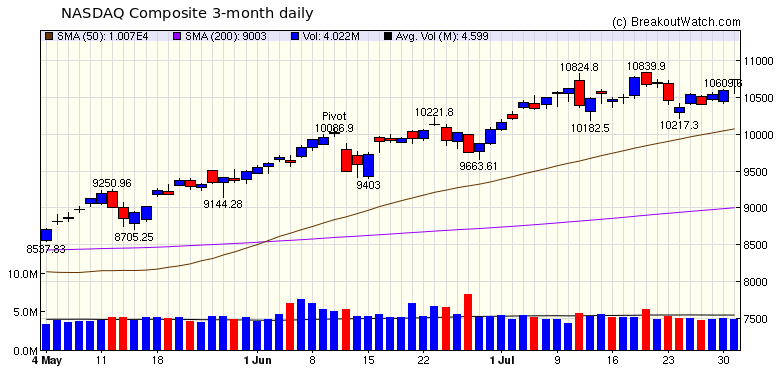 The dominant breakouts this week
came from the cup and handle pattern with an average gain of 5%.
Ultra Clean Holdings (UCTT) delivered the biggest gain (21.5%)
but it was difficult to jump on as it gapped up 10.5% above BoP
at the open.
|
Applied Materials
(AMAT) meets our Buy on Alert criteria. AMAT is listed on the
NASDAQ in the Semiconductor Equipment & Materials industry
group. Since the market bottom it has shown a steady march
higher with successive handle formations and subsequent
breakouts. The current right side handle shows a classic
successful breakout formation since profit taking immediately
after the pivot was set. AMAT closed on Friday just 1.5% below
the breakout price of $65.33.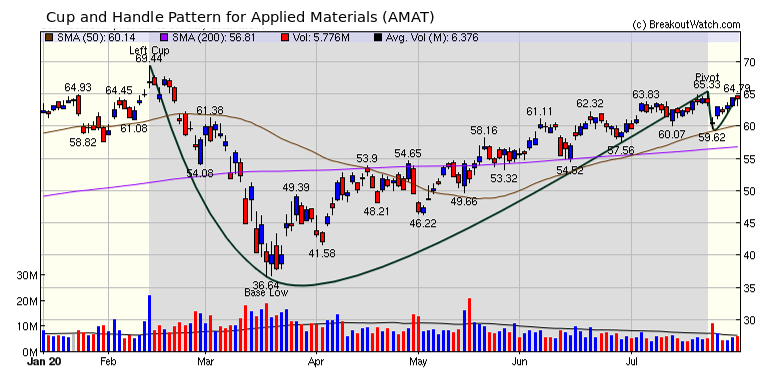 |
| No new features this week |
|
Our latest strategy
suggestions are here.
|
| List | Breakouts | Avg. Gain |
|---|---|---|
| CWH | 10 | 4.95 |
| SQZ | 8 | 3.83 |
| HTF | 1 | 13.97 |
| HSB | 0 | |
| DB | 0 |
| Brkout Date | Symbol | Base | Squeeze | Brkout Price | Brkout Day Close | RS Rank* | Last Close | Current % off BOP | Gain at Intraday High |
|---|---|---|---|---|---|---|---|---|---|
| 2020-07-29 | UCTT | CWH | n | 24.77 | 24.82 | 85 | 30.09 | 21.48% | 25.56% |
| 2020-07-29 | BXC | HTF | n | 12.03 | 12.56 | 67 | 13.71 | 13.97% | 18.87% |
| 2020-07-29 | GRWG | SQZ | y | 7.53 | 8.52 | 92 | 8.44 | 12.08% | 19.39% |
| 2020-07-30 | MRAM | SQZ | y | 7.50 | 8.26 | 94 | 8.39 | 11.87% | 14.4% |
| 2020-07-29 | INSG | SQZ | y | 12.32 | 13.72 | 90 | 13.48 | 9.42% | 12.82% |
| 2020-07-28 | DLHC | CWH | n | 9.30 | 10.29 | 93 | 10.16 | 9.25% | 23.55% |
| 2020-07-30 | QRVO | CWH | y | 121.54 | 128.67 | 83 | 128.15 | 5.44% | 7.67% |
| 2020-07-29 | IIPR | SQZ | y | 99.02 | 104.07 | 80 | 104.23 | 5.26% | 8.06% |
| 2020-07-28 | MEDP | CWH | n | 114.11 | 122.16 | 87 | 119.35 | 4.59% | 26.55% |
| 2020-07-30 | SWKS | CWH | y | 139.88 | 142.19 | 86 | 145.58 | 4.07% | 4.25% |
| 2020-07-30 | INOV | CWH | n | 22.75 | 24.2 | 85 | 23.53 | 3.43% | 13.01% |
| 2020-07-29 | APAM | CWH | n | 35.06 | 35.48 | 81 | 36.23 | 3.34% | 5.02% |
| 2020-07-28 | DOOO | SQZ | y | 44.17 | 45.6 | 84 | 44.78 | 1.38% | 6.34% |
| 2020-07-28 | AXNX | CWH | n | 41.85 | 42.13 | 85 | 42.36 | 1.22% | 5.73% |
| 2020-07-31 | CODX | CWH | n | 23.79 | 24 | 99 | 24 | 0.88% | 4.58% |
| 2020-07-28 | AMKR | SQZ | y | 13.65 | 14.33 | 86 | 13.595 | -0.4% | 15.75% |
| 2020-07-30 | CROX | SQZ | y | 37.38 | 37.54 | 84 | 35.94 | -3.85% | 6.18% |
| 2020-07-27 | ARCB | CWH | n | 31.73 | 32.44 | 83 | 30.39 | -4.22% | 5.67% |
| 2020-07-27 | SPTN | SQZ | y | 22.16 | 23.28 | 91 | 21.025 | -5.12% | 8.03% |
| *RS Rank on day before breakout. | |||||||||
| Symbol | BO Price |
BO Vol. |
Company | Industry | RS Rank |
Last Close |
|---|---|---|---|---|---|---|
| FSK | 16.08 | 2,593,868 | FS KKR Capital Corp. | Asset Management | 98 | 15.90 |
| INSG | 13.90 | 5,937,700 | Inseego Corp. | Communication Equipment | 94 | 13.48 |
| SGRY | 16.69 | 898,226 | Surgery Partners - Inc. | Medical Care Facilities | 90 | 15.27 |
| CTSO | 11.74 | 879,476 | Cytosorbents Corporation | Medical Devices | 89 | 9.58 |
| RAD | 18.64 | 5,827,026 | Rite Aid Corporation | Pharmaceutical Retailers | 88 | 15.16 |
| INFN | 8.14 | 4,297,182 | Infinera Corporation | Communication Equipment | 88 | 7.89 |
| UNIT | 10.31 | 2,524,300 | Uniti Group Inc. | REIT - Industrial | 88 | 9.90 |
| GLUU | 10.84 | 6,636,812 | Glu Mobile Inc. | Electronic Gaming & Multimedia | 85 | 9.44 |
| ADTN | 12.89 | 510,818 | ADTRAN - Inc. | Communication Equipment | 82 | 12.42 |
| MEET | 6.30 | 1,689,824 | The Meet Group - Inc. | Internet Content & Information | 82 | 6.23 |
| These stocks meet our suggested screening factors
for our Cup and Handle Chart Pattern watchlist. See Revised Rules for Trading Cup and Handle Breakouts |
||||||
| Index | Value | Change Week | Change YTD | Trend1 |
|---|---|---|---|---|
| Dow | 26428.3 |
-0.16% | -7.39% | Up |
| NASDAQ | 10745.3 |
3.69% | 19.76% | Up |
| S&P 500 | 3271.12 |
1.73% | 1.25% | Up |
|
1The Market Trend is derived from
our proprietary market model. The market model is described on
the site here.
2The site also shows industry rankings based on fundamentals, combined technical and fundamentals, and on price alone. The site also shows daily industry movements. |
||||
| 1 Week | 13 Weeks | 26 Weeks | Year-to-Date |
|---|---|---|---|
| NASDAQ Composite |
NASDAQ Composite 24.87 |
NASDAQ Composite 17.42 |
NASDAQ Composite 19.76 |
| 1 Week | 3 Weeks | 13 Weeks | 26 Weeks |
|---|---|---|---|
| Silver |
Silver |
Financial Data & Stock Exchanges |
| Beverages - Wineries &
Distilleries 61 |
Beverages - Wineries & Distilleries 50 |
Residential Construction 98 |
Copper 136 |
| Charts of each industry rank and performance over 12 months are available on the site | |||
If you received this newsletter from a friend and you would like to receive it regularly please go to the BreakoutWatch.com site and you will then be able to register to receive the newsletter.
Copyright (c) 08/01/2020 NBIcharts, LLC dba BreakoutWatch.com. All
rights reserved.
" BreakoutWatch," the BreakoutWatch.com "eye" logo, and the slogan
"tomorrow's breakouts today" are service marks of NBIcharts LLC. All
other marks are the property of their respective owners, and are used
for descriptive purposes only.
BreakoutWatch is not affiliated with Investor's Business Daily or with Mr. William O'Neil. Our site, research and analysis is supported entirely by subscription and is free from advertising.