Breakoutwatch Weekly Summary 08/29/20
You are receiving this email because you are or were a
BreakoutWatch.com subscriber, or have subscribed to our weekly
newsletter. This newsletter summarizes the breakout events of the week
and provides additional guidance that does not fit into our daily
format. It is published each weekend.
Newsletter Archive: https://www.breakoutwatch.com/content/newsletters
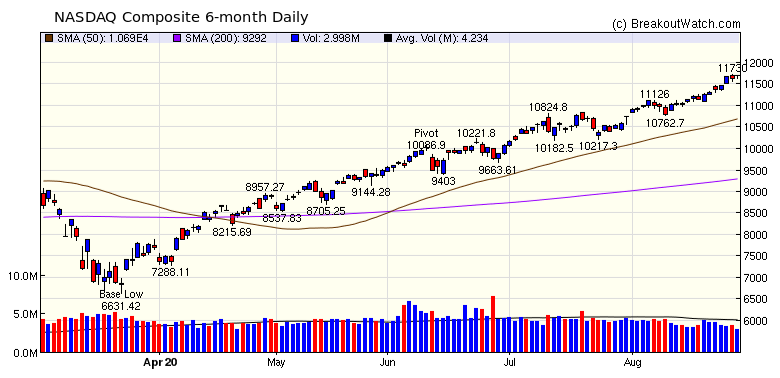
NASDAQ Gains 3.5%; Are we in a
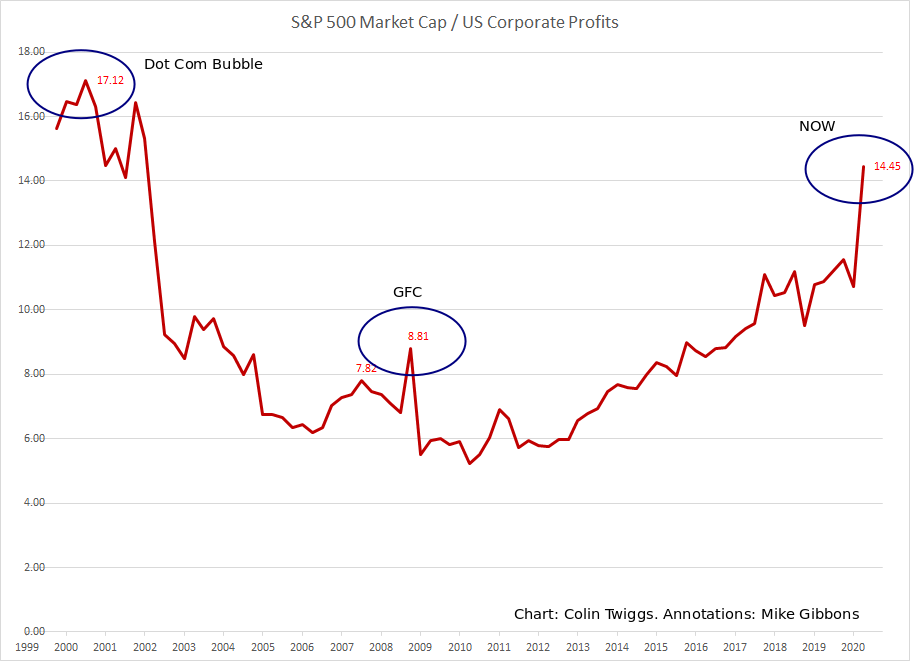
Bubble? Today, the Federal Reserve is playing the role of the venture capitalists of the 2000's. This week, the Fed announced that it was abandoning it's 2% inflation target. It had already announced that interest rates would stay close to zero until 2022 and has injected $3 trillion into financial markets since February. With interest rates so low, companies can borrow cheaply to fund investment, and the corollary is that investors have no where else to go for income than the stock market. Australian writer Colin Twiggs in his newsletter this week proposes one way to think about the potential bubble is to compare corporate profits to market capitalization. Under this analysis when corporate profits are low compared to valuations, then stock prices are overvalued. His chart below, with my annotations, indicates we are getting close the levels of the 2000 bubble.  |
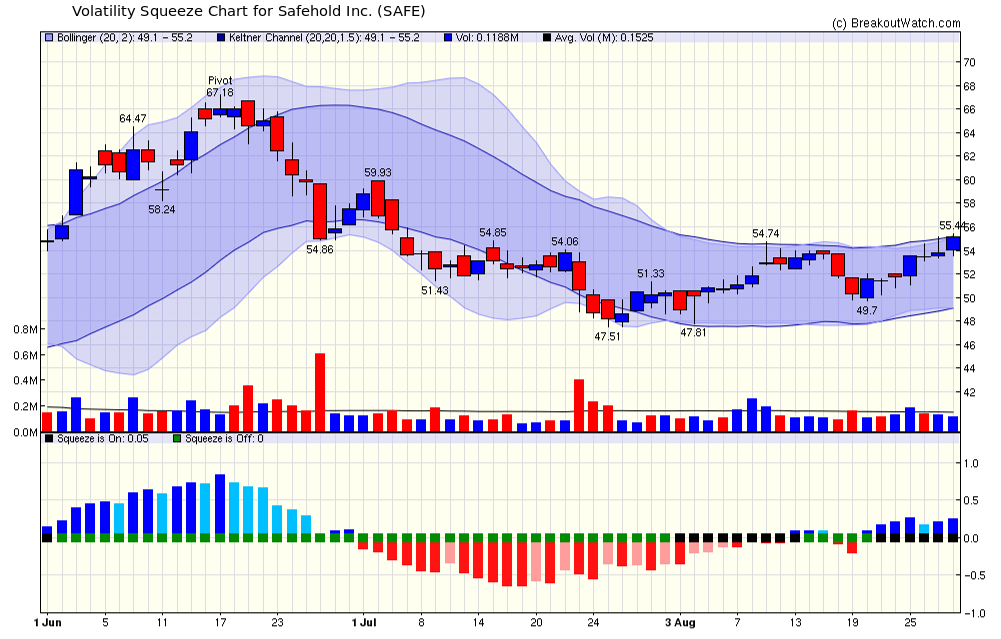
Safehold Inc. (SAFE) is in a Volatility Squeeze and appears
ready to breakout to the upside. The chart shows it has plenty
of potential to gain up to 20% back to the pivot point if its
previous cup and handle pattern. |
| No new features this week |
|
Our latest strategy
suggestions are here.
I was asked a question on the
Support Forum about a statement in our "How to Use Our Site"
page about how to recognize a flawed base. The answer is here.
|
| List | Breakouts | Avg. Gain |
|---|---|---|
| CWH | 1 | 0.4 |
| SQZ | 5 | 5.13 |
| HTF | 1 | -2.79 |
| HSB | 0 | |
| DB | 1 | 2.56 |
| Brkout Date | Symbol | Base | Squeeze | Brkout Price | Brkout Day Close | RS Rank* | Last Close | Current % off BOP | Gain at Intraday High |
|---|---|---|---|---|---|---|---|---|---|
| 2020-08-25 | CCH | SQZ | y | 13.91 | 15 | 84 | 16.34 | 17.47% | 22.21% |
| 2020-08-26 | CCH | SQZ | y | 15.01 | 15.8 | 87 | 16.34 | 8.86% | 13.26% |
| 2020-08-27 | IMAB | SQZ | y | 30.20 | 31.24 | 96 | 31 | 2.65% | 12.52% |
| 2020-08-26 | NFLX | DB | n | 510.82 | 547.53 | 85 | 523.89 | 2.56% | 7.47% |
| 2020-08-25 | AMRC | CWH | n | 32.55 | 34.2 | 93 | 32.68 | 0.4% | 7.1% |
| 2020-08-24 | BLDP | SQZ | y | 16.23 | 16.49 | 96 | 15.99 | -1.48% | 9.67% |
| 2020-08-25 | SWTX | SQZ | y | 44.90 | 44.96 | 89 | 44.07 | -1.85% | 7.86% |
| 2020-08-25 | DQ | HTF | n | 128.76 | 133.37 | 97 | 125.17 | -2.79% | 6.42% |
| *RS Rank on day before breakout. | |||||||||
| Symbol | BO Price |
BO Vol. |
Company | Industry | RS Rank |
Last Close |
|---|---|---|---|---|---|---|
| FUV | 8.23 | 2,490,706 | Arcimoto - Inc. | Recreational Vehicles | 98 | 6.50 |
| FSK | 17.25 | 1,128,050 | FS KKR Capital Corp. | Asset Management | 98 | 16.07 |
| SURF | 7.20 | 1,192,450 | Surface Oncology - Inc. | Biotechnology | 95 | 6.19 |
| OESX | 6.21 | 618,735 | Orion Energy Systems - Inc. | Electrical Equipment & Parts | 93 | 6.17 |
| CBB | 15.14 | 687,933 | Cinci | Telecom Services | 92 | 15.05 |
| EQT | 17.97 | 7,133,532 | EQT Corporation | Oil & Gas E&P | 92 | 16.02 |
| LCA | 16.86 | 5,228,536 | Landcadia Holdings II - Inc. | Shell Companies | 90 | 15.29 |
| CNX | 12.27 | 5,891,062 | CNX Resources Corporation | Oil & Gas E&P | 89 | 11.30 |
| UNIT | 10.50 | 2,095,503 | Uniti Group Inc. | REIT - Industrial | 82 | 9.85 |
| LPL | 6.59 | 531,453 | LG Display Co - Ltd AMERIC | Consumer Electronics | 81 | 6.35 |
| These stocks meet our suggested screening factors
for our Cup and Handle Chart Pattern watchlist. See Revised Rules for Trading Cup and Handle Breakouts |
||||||
| Index | Value | Change Week | Change YTD | Trend1 |
|---|---|---|---|---|
| Dow | 28653.9 |
2.59% | 0.4% | Up |
| NASDAQ | 11695.6 |
3.39% | 30.35% | Up |
| S&P 500 | 3508.01 |
3.26% | 8.58% | Up |
|
1The Market Trend is derived from
our proprietary market model. The market model is described on
the site here.
2The site also shows industry rankings based on fundamentals, combined technical and fundamentals, and on price alone. The site also shows daily industry movements. |
||||
| 1 Week | 13 Weeks | 26 Weeks | Year-to-Date |
|---|---|---|---|
| NASDAQ Composite |
NASDAQ Composite 23.24 |
NASDAQ Composite 36.51 |
NASDAQ Composite 30.35 |
| 1 Week | 3 Weeks | 13 Weeks | 26 Weeks |
|---|---|---|---|
| Silver |
Silver |
Medical Distribution |
| Lodging 21 |
Agricultural Inputs 39 |
Furnishings, Fixtures & Appliances 60 |
Copper 139 |
| Charts of each industry rank and performance over 12 months are available on the site | |||
If you received this newsletter from a friend and you would like to receive it regularly please go to the BreakoutWatch.com site and you will then be able to register to receive the newsletter.
Copyright (c) 08/29/2020 NBIcharts, LLC dba BreakoutWatch.com. All
rights reserved.
" BreakoutWatch," the BreakoutWatch.com "eye" logo, and the slogan
"tomorrow's breakouts today" are service marks of NBIcharts LLC. All
other marks are the property of their respective owners, and are used
for descriptive purposes only.
BreakoutWatch is not affiliated with Investor's Business Daily or with Mr. William O'Neil. Our site, research and analysis is supported entirely by subscription and is free from advertising.