Breakoutwatch Weekly Summary 09/05/20
You are receiving this email because you are or were a
BreakoutWatch.com subscriber, or have subscribed to our weekly
newsletter. This newsletter summarizes the breakout events of the week
and provides additional guidance that does not fit into our daily
format. It is published each weekend.
Newsletter Archive: https://www.breakoutwatch.com/content/newsletters
| Watchlists Display Restored; NASDAQ
finds Support at 50 DMA On Thursday, I introduced a bug that caused the watchlist displays to be corrupted. That has been corrected and the watchlists are now functioning normally. Profit taking in the top tech stocks began on Wednesday which scared investors into a sharp, broad selloff on Thursday causing the NASDAQ to lose 5%. A buy-the-dip rally at the open on Friday quickly faded and the index dropped 4.4% before recovering to lose 1.3% for the day and 3.3% for the week. Where we go from here no one knows! 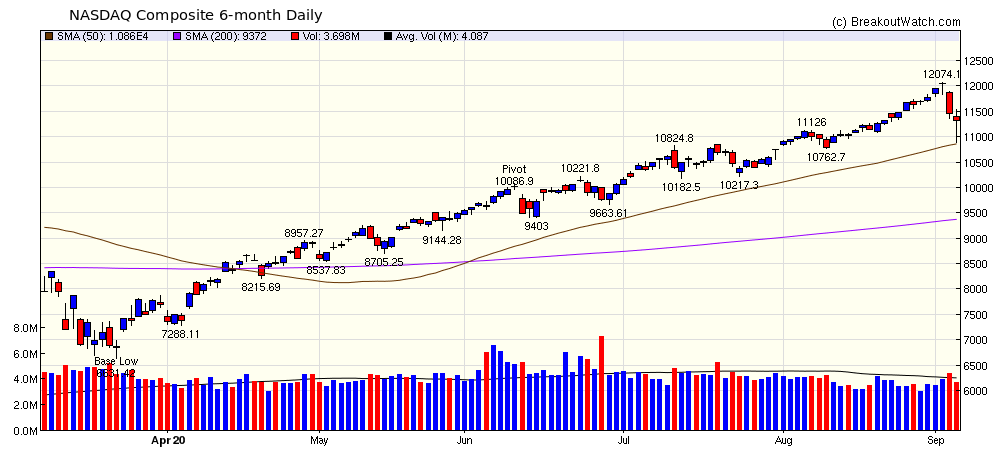 |
| No chart of the
week, this week. Have a happy and safe Holiday weekend and Wear a Mask! |
| No new features this week |
|
Our latest strategy
suggestions are here.
|
| List | Breakouts | Avg. Gain |
|---|---|---|
| CWH | 7 | -4.48 |
| SQZ | 5 | 1.82 |
| HTF | 2 | -6.84 |
| HSB | 0 | |
| DB | 1 | -9.99 |
| Brkout Date | Symbol | Base | Squeeze | Brkout Price | Brkout Day Close | RS Rank* | Last Close | Current % off BOP | Gain at Intraday High |
|---|---|---|---|---|---|---|---|---|---|
| 2020-09-03 | NAV | CWH | y | 34.30 | 35.28 | 80 | 37.35 | 8.89% | 9.75% |
| 2020-09-04 | NAV | SQZ | y | 35.29 | 37.35 | 85 | 37.35 | 5.84% | 6.67% |
| 2020-09-01 | MYOK | SQZ | y | 109.45 | 113.88 | 90 | 113.31 | 3.53% | 5.43% |
| 2020-09-01 | EPIX | SQZ | y | 7.04 | 7.25 | 92 | 7.26 | 3.13% | 5.97% |
| 2020-09-04 | VIRT | CWH | n | 27.17 | 27.32 | 86 | 27.32 | 0.55% | 1.58% |
| 2020-08-31 | AVNW | SQZ | y | 20.61 | 21.68 | 88 | 20.55 | -0.29% | 7.59% |
| 2020-08-31 | MGNX | SQZ | y | 27.31 | 28.94 | 95 | 26.46 | -3.11% | 6.7% |
| 2020-09-01 | LB | HTF | n | 31.33 | 31.54 | 92 | 30.14 | -3.8% | 1.92% |
| 2020-09-01 | BILI | CWH | n | 49.98 | 52.25 | 96 | 47.02 | -5.92% | 8.04% |
| 2020-09-01 | RPD | CWH | n | 65.41 | 66.46 | 82 | 61.25 | -6.36% | 3.59% |
| 2020-09-02 | ADSK | CWH | n | 254.35 | 261.35 | 85 | 233.88 | -8.05% | 2.98% |
| 2020-09-02 | CYCN | CWH | n | 6.91 | 7.7 | 94 | 6.25 | -9.55% | 12.88% |
| 2020-08-31 | EXPI | HTF | n | 42.85 | 44.48 | 99 | 38.62 | -9.87% | 8.7% |
| 2020-09-01 | MDB | DB | n | 238.32 | 250.72 | 84 | 214.51 | -9.99% | 8.28% |
| 2020-09-01 | RPAY | CWH | n | 26.52 | 26.99 | 89 | 23.62 | -10.94% | 3.9% |
| *RS Rank on day before breakout. | |||||||||
| Symbol | BO Price |
BO Vol. |
Company | Industry | RS Rank |
Last Close |
|---|---|---|---|---|---|---|
| SURF | 7.44 | 1,269,120 | Surface Oncology - Inc. | Biotechnology | 96 | 6.06 |
| CBB | 15.14 | 623,616 | Cinci | Telecom Services | 93 | 15.11 |
| EQT | 17.97 | 6,551,012 | EQT Corporation | Oil & Gas E&P | 92 | 15.36 |
| CNX | 12.27 | 5,799,249 | CNX Resources Corporation | Oil & Gas E&P | 89 | 10.53 |
| INSU | 14.20 | 822,782 | Insurance Acquisition Corp. | Shell Companies | 86 | 13.33 |
| NG | 10.80 | 3,117,234 | Novagold Resources Inc. | Gold | 86 | 10.68 |
| MEET | 6.33 | 1,356,676 | The Meet Group - Inc. | Internet Content & Information | 81 | 6.29 |
| NWSA | 15.46 | 2,664,110 | News Corporation | Broadcasting | 80 | 14.95 |
| BCOV | 13.34 | 637,428 | Brightcove Inc. | Software - Application | 80 | 10.33 |
| DB | 9.93 | 5,414,259 | Deutsche Bank AG | Banks - Regional | 80 | 9.73 |
| These stocks meet our suggested screening factors
for our Cup and Handle Chart Pattern watchlist. See Revised Rules for Trading Cup and Handle Breakouts |
||||||
| Index | Value | Change Week | Change YTD | Trend1 |
|---|---|---|---|---|
| Dow | 28133.3 |
-1.82% | -1.42% | Up |
| NASDAQ | 11313.1 |
-3.27% | 26.08% | Up |
| S&P 500 | 3426.96 |
-2.31% | 6.07% | Up |
|
1The Market Trend is derived from
our proprietary market model. The market model is described on
the site here.
2The site also shows industry rankings based on fundamentals, combined technical and fundamentals, and on price alone. The site also shows daily industry movements. |
||||
| 1 Week | 13 Weeks | 26 Weeks | Year-to-Date |
|---|---|---|---|
| Dow Jones |
NASDAQ Composite 15.27 |
NASDAQ Composite 31.92 |
NASDAQ Composite 26.08 |
| 1 Week | 3 Weeks | 13 Weeks | 26 Weeks |
|---|---|---|---|
| Silver |
Silver |
REIT - Industrial |
| Beverages - Wineries &
Distilleries 85 |
Beverages - Wineries & Distilleries 85 |
Other Precious Metals & Mining 87 |
Copper 140 |
| Charts of each industry rank and performance over 12 months are available on the site | |||
If you received this newsletter from a friend and you would like to receive it regularly please go to the BreakoutWatch.com site and you will then be able to register to receive the newsletter.
Copyright (c) 09/05/2020 NBIcharts, LLC dba BreakoutWatch.com. All
rights reserved.
" BreakoutWatch," the BreakoutWatch.com "eye" logo, and the slogan
"tomorrow's breakouts today" are service marks of NBIcharts LLC. All
other marks are the property of their respective owners, and are used
for descriptive purposes only.
BreakoutWatch is not affiliated with Investor's Business Daily or with Mr. William O'Neil. Our site, research and analysis is supported entirely by subscription and is free from advertising.