Breakoutwatch Weekly Summary 09/19/20
You are receiving this email because you are or were a
BreakoutWatch.com subscriber, or have subscribed to our weekly
newsletter. This newsletter summarizes the breakout events of the week
and provides additional guidance that does not fit into our daily
format. It is published each weekend.
Newsletter Archive: https://www.breakoutwatch.com/content/newsletters
| Sector Rotation out of Large Cap
Tech Creates Breakout Opportunities The three major indexes continued their decline this week as investors continued to take profits from the large cap tech stocks and our market trend indicators continued to point downwards. The NASDAQ Composite and S&P 500 gave up 0.6% each and the DJI remained essentially flat with a loss of just 0.03%. The NASDAQ rallied earlier in the week but failed to sustain a rally above its 50 day moving average. In contrast to the large cap indexes, the Russel 2000 gained 2.5% reflecting the losing attraction of big cap tech stocks and signalling a rotation into small cap and cyclical investments. 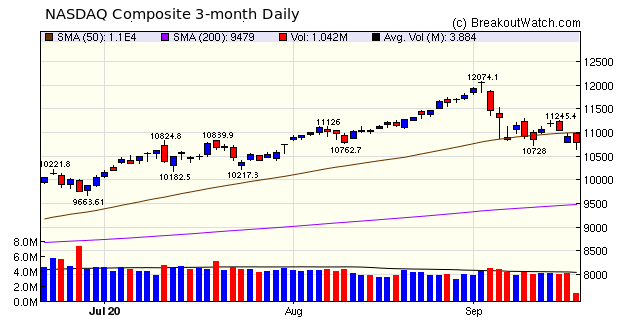 The rotation provided an
opportunity for an unusually large number of breakouts, despite
the negative trend of our major trend indicators. Breakouts from
a Volatility Squeeze pattern dominated the week with
15breakouts. The steep rise of the markets has created several
High Tight Flag situations and we saw 6 HTF breakouts this week.
|
Speaking of High
Tight Flag situations, ZOOM communications (ZM), a darling of
tech stocks since the lock down, is bucking the trend of
rotation out of tech with a 7.5% gain on Friday on 2.5 times
average volume. Zoom is building a nice shape in the handle
since profit taking in early September and could be set to move
higher still.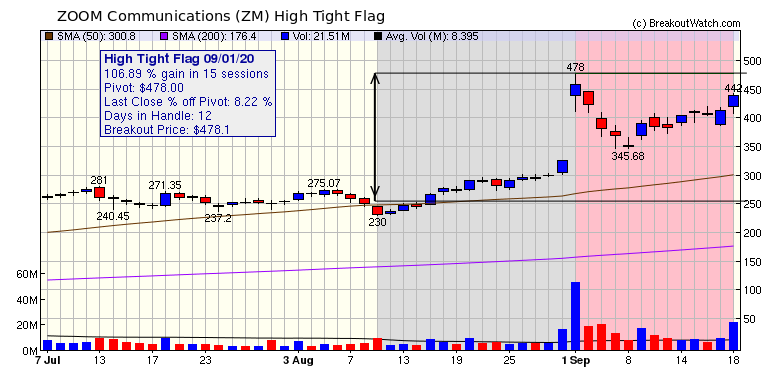 |
| No new features this week |
|
Our latest strategy
suggestions are here.
|
| List | Breakouts | Avg. Gain |
|---|---|---|
| CWH | 5 | 3.17 |
| SQZ | 15 | 3.43 |
| HTF | 6 | 3.39 |
| HSB | 0 | |
| DB | 0 |
| Brkout Date | Symbol | Base | Squeeze | Brkout Price | Brkout Day Close | RS Rank* | Last Close | Current % off BOP | Gain at Intraday High |
|---|---|---|---|---|---|---|---|---|---|
| 2020-09-15 | GSX | SQZ | y | 91.13 | 101.12 | 98 | 106.52 | 16.89% | 17.61% |
| 2020-09-16 | GME | HTF | n | 8.45 | 8.68 | 88 | 9.47 | 12.07% | 15.62% |
| 2020-09-14 | GRBK | SQZ | y | 16.29 | 17.6 | 91 | 18.07 | 10.93% | 15.35% |
| 2020-09-18 | BLNK | SQZ | y | 7.62 | 8.39 | 98 | 8.39 | 10.1% | 11.42% |
| 2020-09-18 | STOK | CWH | n | 35.00 | 37.48 | 88 | 37.48 | 7.09% | 8.14% |
| 2020-09-15 | DAVA | CWH | n | 56.68 | 56.75 | 80 | 59.52 | 5.01% | 5.17% |
| 2020-09-16 | DAVA | SQZ | y | 56.76 | 57.18 | 81 | 59.52 | 4.86% | 5.02% |
| 2020-09-17 | DAVA | SQZ | y | 57.19 | 58.65 | 82 | 59.52 | 4.07% | 4.23% |
| 2020-09-17 | MGNX | CWH | n | 30.39 | 31.22 | 97 | 31.6 | 3.98% | 5.33% |
| 2020-09-16 | BCYC | SQZ | y | 19.04 | 20.71 | 90 | 19.76 | 3.78% | 13.39% |
| 2020-09-14 | RUN | HTF | n | 58.92 | 59.1 | 99 | 60.86 | 3.29% | 8.49% |
| 2020-09-14 | VSLR | HTF | n | 32.25 | 32.41 | 99 | 33.24 | 3.07% | 8.71% |
| 2020-09-17 | PROF | SQZ | y | 16.68 | 17.46 | 88 | 16.99 | 1.86% | 4.68% |
| 2020-09-18 | TFFP | HTF | n | 16.26 | 16.51 | 98 | 16.51 | 1.54% | 1.54% |
| 2020-09-18 | MGNX | SQZ | y | 31.23 | 31.6 | 98 | 31.6 | 1.18% | 2.5% |
| 2020-09-18 | BSGM | SQZ | y | 8.50 | 8.6 | 85 | 8.6 | 1.18% | 5.88% |
| 2020-09-18 | FATE | CWH | n | 38.89 | 39.25 | 90 | 39.25 | 0.93% | 1.43% |
| 2020-09-18 | IRTC | HTF | n | 232.58 | 233.33 | 97 | 233.33 | 0.32% | 3.96% |
| 2020-09-18 | ADUS | SQZ | y | 96.09 | 96.33 | 85 | 96.33 | 0.25% | 1.38% |
| 2020-09-18 | EGO | SQZ | y | 11.79 | 11.81 | 88 | 11.81 | 0.17% | 3.48% |
| 2020-09-14 | AIMT | HTF | n | 34.28 | 34.31 | 92 | 34.3 | 0.06% | 0.58% |
| 2020-09-18 | MORF | SQZ | y | 28.87 | 28.88 | 91 | 28.88 | 0.03% | 2.32% |
| 2020-09-15 | SSRM | SQZ | y | 22.10 | 22.29 | 87 | 22.08 | -0.09% | 5.29% |
| 2020-09-14 | FUL | CWH | y | 50.16 | 50.36 | 80 | 49.58 | -1.16% | 3.67% |
| 2020-09-14 | AEM | SQZ | y | 82.19 | 86.47 | 89 | 80.72 | -1.79% | 8.57% |
| 2020-09-15 | IRBT | SQZ | y | 79.82 | 83.49 | 86 | 78.23 | -1.99% | 8.82% |
| *RS Rank on day before breakout. | |||||||||
| Symbol | BO Price |
BO Vol. |
Company | Industry | RS Rank |
Last Close |
|---|---|---|---|---|---|---|
| CLDX | 13.43 | 948,033 | Celldex Therapeutics - Inc. | Biotechnology | 98 | 12.94 |
| SPAQ | 18.24 | 14,527,203 | Spartan Energy Acquisition Corp Class A | Shell Companies | 90 | 16.90 |
| SILV | 10.71 | 1,405,192 | SilverCrest Metals Inc. | Other Industrial Metals & Mining | 90 | 10.16 |
| ATRA | 16.30 | 1,249,569 | Atara Biotherapeutics - Inc. | Biotechnology | 86 | 15.87 |
| SCPL | 15.83 | 1,141,512 | SciPlay Corporation | Electronic Gaming & Multimedia | 84 | 15.40 |
| DAN | 15.14 | 1,889,664 | Dana Inco | Auto Parts | 81 | 13.16 |
| These stocks meet our suggested screening factors
for our Cup and Handle Chart Pattern watchlist. See Revised Rules for Trading Cup and Handle Breakouts |
||||||
| Index | Value | Change Week | Change YTD | Trend1 |
|---|---|---|---|---|
| Dow | 27657.4 |
-0.03% | -3.09% | Down |
| NASDAQ | 10793.3 |
-0.55% | 20.29% | Down |
| S&P 500 | 3319.47 |
-0.64% | 2.75% | Down |
|
1The Market Trend is derived from
our proprietary market model. The market model is described on
the site here.
2The site also shows industry rankings based on fundamentals, combined technical and fundamentals, and on price alone. The site also shows daily industry movements. |
||||
| 1 Week | 13 Weeks | 26 Weeks | Year-to-Date |
|---|---|---|---|
| Dow Jones |
NASDAQ Composite 8.52 |
NASDAQ Composite 56.89 |
NASDAQ Composite 20.29 |
| 1 Week | 3 Weeks | 13 Weeks | 26 Weeks |
|---|---|---|---|
| Silver |
Silver |
Shell Companies |
| Coking Coal 55 |
Beverages - Wineries & Distilleries 81 |
Other Precious Metals & Mining 102 |
Copper 137 |
| Charts of each industry rank and performance over 12 months are available on the site | |||
If you received this newsletter from a friend and you would like to receive it regularly please go to the BreakoutWatch.com site and you will then be able to register to receive the newsletter.
Copyright (c) 09/19/2020 NBIcharts, LLC dba BreakoutWatch.com. All
rights reserved.
" BreakoutWatch," the BreakoutWatch.com "eye" logo, and the slogan
"tomorrow's breakouts today" are service marks of NBIcharts LLC. All
other marks are the property of their respective owners, and are used
for descriptive purposes only.
BreakoutWatch is not affiliated with Investor's Business Daily or with Mr. William O'Neil. Our site, research and analysis is supported entirely by subscription and is free from advertising.