Breakoutwatch Weekly Summary 10/10/20
You are receiving this email because you are or were a
BreakoutWatch.com subscriber, or have subscribed to our weekly
newsletter. This newsletter summarizes the breakout events of the week
and provides additional guidance that does not fit into our daily
format. It is published each weekend.
Newsletter Archive: https://www.breakoutwatch.com/content/newsletters
| Breakouts Average 6.9% as Trend
Indicators Turn Positive Our market trend indicators for the three major indexes all turned positive after Monday's session. This proved quite providential as the NASDAQ Composite gained 4.6% this week. Technology stocks re-assumed a leadership role but investors also saw future value in small cap/value/cyclical stocks and pushed the Russel 2000 higher by 6.4%. The DJI and S&P 500 lagged by 3.3% and 3.8% respectively. Earnings season is ahead and there will likely be many upside surprises as expectations are low. This will likely improve optimism for 2021 and the markets should respond positively. On the other hand, the potential for uncertainty about the election outcome, that could last for several weeks, will depress markets until there sis a resolution the country can accept. 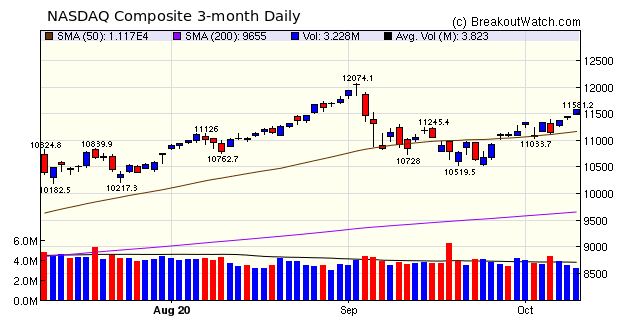 There were 19 confirmed breakouts
this week delivering an average return of 6.9% above their
breakout price. Volatility Squeeze (SQZ) breakouts dominated in
quantity and didn't disappoint in outcomes. This Friday, there
were twice as many on the SQZ list as the previous Friday, so
they will probably dominate again in the coming week.
|
When it became
known last weekend that the The President was given Regeneron,
the stock broke out from a SQZ pattern on Monday. Since then,
the stock moved sideways and was still left in a SQZ pattern on
Friday. Now that The President is apparently Covid-19 free, we
may see renewed interest on Monday and a further breakout.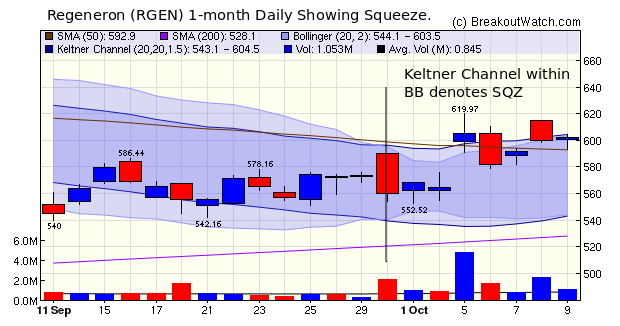 |
| No new features this week |
|
Our latest strategy
suggestions are here.
|
| List | Breakouts | Avg. Gain % |
|---|---|---|
| CWH | 6 | 6.06 |
| SQZ | 10 | 6.08 |
| HTF | 1 | 12.49 |
| HSB | 0 | |
| DB | 2 | 10.37 |
| Total | 19 | 6.9 |
| Brkout Date | Symbol | Base | Squeeze | Brkout Price | Brkout Day Close | RS Rank* | Last Close | Current % off BOP | Gain at Intraday High |
|---|---|---|---|---|---|---|---|---|---|
| 2020-10-06 | QTRX | SQZ | y | 35.36 | 36.9 | 87 | 46.15 | 30.51% | 38.43% |
| 2020-10-07 | QTRX | SQZ | y | 36.91 | 43.38 | 90 | 46.15 | 25.03% | 32.62% |
| 2020-10-06 | BE | CWH | n | 18.72 | 19.53 | 96 | 22.92 | 22.44% | 24.89% |
| 2020-10-09 | NIU | CWH | n | 23.83 | 27.05 | 95 | 27.05 | 13.51% | 13.72% |
| 2020-10-05 | OCN | HTF | n | 24.09 | 24.61 | 99 | 27.1 | 12.49% | 15.01% |
| 2020-10-07 | CRSP | SQZ | y | 87.73 | 97.68 | 90 | 98.26 | 12% | 14.99% |
| 2020-10-05 | RGEN | DB | y | 152.77 | 159.8 | 91 | 170.5 | 11.61% | 12.58% |
| 2020-10-05 | APPF | SQZ | y | 147.57 | 154.34 | 80 | 164.31 | 11.34% | 11.53% |
| 2020-10-06 | NEP | DB | y | 61.64 | 62.75 | 73 | 67.27 | 9.13% | 10.95% |
| 2020-10-08 | CARV | SQZ | y | 6.60 | 7.53 | 95 | 7.06 | 6.97% | 40.15% |
| 2020-10-05 | TITN | SQZ | y | 14.32 | 14.95 | 80 | 15.22 | 6.28% | 7.4% |
| 2020-10-05 | SQM | CWH | n | 34.92 | 35.46 | 81 | 35.54 | 1.78% | 4.27% |
| 2020-10-08 | REGN | SQZ | y | 591.70 | 599.88 | 81 | 602.07 | 1.75% | 3.94% |
| 2020-10-05 | FFG | SQZ | y | 49.96 | 50.88 | 84 | 50.82 | 1.72% | 2.5% |
| 2020-10-08 | MWK | SQZ | y | 8.75 | 8.93 | 96 | 8.89 | 1.6% | 6.7% |
| 2020-10-08 | BCLI | CWH | n | 17.39 | 17.73 | 97 | 17.55 | 0.92% | 3.22% |
| 2020-10-05 | MOBL | CWH | n | 7.06 | 7.08 | 88 | 7.03 | -0.42% | 0.42% |
| 2020-10-05 | SCPL | CWH | n | 16.98 | 17.31 | 83 | 16.66 | -1.88% | 8.95% |
| 2020-10-05 | CYTK | SQZ | y | 24.00 | 28.61 | 93 | 15.26 | -36.42% | 25.58% |
| *RS Rank on day before breakout. | |||||||||
| Symbol | BO Price |
BO Vol. |
Company | Industry | RS Rank |
Last Close |
|---|---|---|---|---|---|---|
| BLNK | 11.55 | 10,435,527 | Blink Charging Co. | Specialty Retail | 98 | 9.76 |
| FSK | 16.70 | 840,222 | FS KKR Capital Corp. | Asset Management | 97 | 16.21 |
| ISEE | 6.38 | 1,277,628 | IVERIC bio - Inc. | Biotechnology | 96 | 6.13 |
| GPRE | 16.70 | 779,548 | Green Plains - Inc. | Specialty Chemicals | 94 | 16.29 |
| SOGO | 8.94 | 2,328,930 | Sogou Inc. | Internet Content & Information | 93 | 8.88 |
| IDT | 11.86 | 529,628 | IDT Corporation Class B | Telecom Services | 92 | 11.02 |
| CBB | 15.22 | 620,830 | Cinci | Telecom Services | 91 | 15.07 |
| ALDX | 7.79 | 967,395 | Aldeyra Therapeutics - Inc. | Biotechnology | 91 | 7.05 |
| TACO | 9.63 | 721,950 | Del Taco Restaurants - Inc. | Restaurants | 87 | 9.42 |
| HBI | 17.33 | 7,895,718 | Hanesbrands Inc. | Apparel Manufacturing | 87 | 17.21 |
| These stocks meet our suggested screening factors
for our Cup and Handle Chart Pattern watchlist. See Revised Rules for Trading Cup and Handle Breakouts |
||||||
| Index | Value | Change Week | Change YTD | Trend1 |
|---|---|---|---|---|
| Dow | 28586.9 |
3.27% | 0.17% | Up |
| NASDAQ | 11579.9 |
4.56% | 29.06% | Up |
| S&P 500 | 3477.13 |
3.84% | 7.63% | Up |
|
1The Market Trend is derived from
our proprietary market model. The market model is described on
the site here.
2The site also shows industry rankings based on fundamentals, combined technical and fundamentals, and on price alone. The site also shows daily industry movements. |
||||
| 1 Week | 13 Weeks | 26 Weeks | Year-to-Date |
|---|---|---|---|
| NASDAQ Composite |
Dow Jones 9.07 |
NASDAQ Composite 41.35 |
NASDAQ Composite 29.06 |
| 1 Week | 3 Weeks | 13 Weeks | 26 Weeks |
|---|---|---|---|
| Solar |
Silver |
Shell Companies |
| Personal Services 40 |
Coking Coal 86 |
Coking Coal 114 |
Copper 134 |
| Charts of each industry rank and performance over 12 months are available on the site | |||
If you received this newsletter from a friend and you would like to receive it regularly please go to the BreakoutWatch.com site and you will then be able to register to receive the newsletter.
Copyright (c) 10/10/2020 NBIcharts, LLC dba BreakoutWatch.com. All
rights reserved.
" BreakoutWatch," the BreakoutWatch.com "eye" logo, and the slogan
"tomorrow's breakouts today" are service marks of NBIcharts LLC. All
other marks are the property of their respective owners, and are used
for descriptive purposes only.
BreakoutWatch is not affiliated with Investor's Business Daily or with Mr. William O'Neil. Our site, research and analysis is supported entirely by subscription and is free from advertising.