Breakoutwatch Weekly Summary 10/17/20
You are receiving this email because you are or were a
BreakoutWatch.com subscriber, or have subscribed to our weekly
newsletter. This newsletter summarizes the breakout events of the week
and provides additional guidance that does not fit into our daily
format. It is published each weekend.
Newsletter Archive: https://www.breakoutwatch.com/content/newsletters
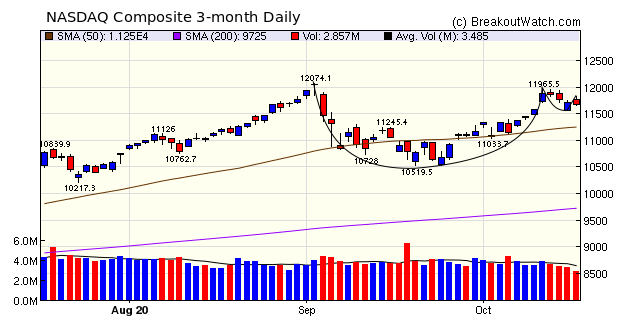
| NASDAQ Forms Cup and Handle as
Indexes Consolidate The NASDAQ gapped up on Monday to set the high point for the week, but was in consolidation mode for the rest of the week as several disappointments weighed on the markets:
News on Friday that September
retail sales rose unexpectedly lifted markets for most of the
day but the NASDAQ still closed for a loss. The NASDAQ chart
shows a cup and handle pattern has formed but the handle price
and volume performance does not indicate a breakout is imminent.
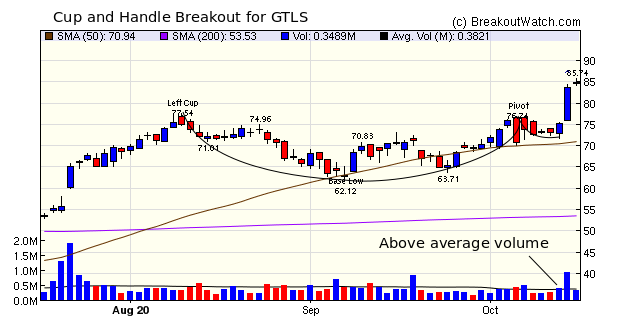
 Declining volume failed to provide
the momentum needed for successful breakouts this week with just
one (GTLS)from a cup and handle pattern. Above average volume on
Wednesday before Thursday's breakout was an indication that a
strong breakout could be imminent.
 |
With the NASDAQ
showing a cup and handle pattern, it is perhaps logical to look
at stocks in this pattern for potential future breakouts. Of
those on Friday's list I've chosen BioNTech SE [BNTX] as having
the best right cup performance and handle potential.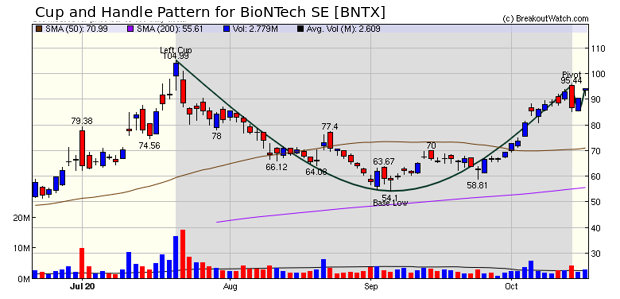 |
| No new features this week |
|
Our latest strategy
suggestions are here.
|
| List | Breakouts | Avg. Gain |
|---|---|---|
| CWH | 1 | 10.22 |
| SQZ | 7 | 0.01 |
| HTF | 0 | |
| HSB | 0 | |
| DB | 0 |
| Brkout Date | Symbol | Base | Squeeze | Brkout Price | Brkout Day Close | RS Rank* | Last Close | Current % off BOP | Gain at Intraday High |
|---|---|---|---|---|---|---|---|---|---|
| 2020-10-14 | GTLS | CWH | n | 76.74 | 83.67 | 90 | 84.58 | 10.22% | 11.72% |
| 2020-10-12 | EVRI | SQZ | y | 8.55 | 9.38 | 87 | 9 | 5.26% | 12.4% |
| 2020-10-12 | FUV | SQZ | y | 6.38 | 6.9 | 95 | 6.63 | 3.92% | 17.87% |
| 2020-10-12 | JD | SQZ | y | 79.80 | 84.32 | 93 | 81.52 | 2.16% | 7% |
| 2020-10-12 | BRP | SQZ | y | 27.31 | 28.6 | 94 | 27.66 | 1.28% | 10.18% |
| 2020-10-12 | ACMR | SQZ | y | 75.46 | 77.79 | 97 | 75.6 | 0.19% | 9.55% |
| 2020-10-14 | USAK | SQZ | y | 10.80 | 10.95 | 90 | 10.44 | -3.33% | 5.37% |
| 2020-10-15 | FUV | SQZ | y | 7.32 | 10.95 | 97 | 6.63 | -9.43% | 2.73% |
| *RS Rank on day before breakout. | |||||||||
| Symbol | BO Price |
BO Vol. |
Company | Industry | RS Rank |
Last Close |
|---|---|---|---|---|---|---|
| GRWG | 19.34 | 10,316,637 | GrowGeneration Corp. | Home Improvement Retail | 98 | 17.39 |
| BLNK | 11.55 | 9,531,459 | Blink Charging Co. | Specialty Retail | 98 | 9.77 |
| BCLI | 17.95 | 633,723 | Brainstorm Cell Therapeutics Inc. | Biotechnology | 96 | 13.86 |
| SOGO | 8.94 | 2,063,595 | Sogou Inc. | Internet Content & Information | 94 | 8.88 |
| BLDP | 19.21 | 6,731,370 | Ballard Power Systems - Inc. | Specialty Industrial Machinery | 92 | 17.89 |
| IDT | 11.86 | 540,046 | IDT Corporation Class B | Telecom Services | 91 | 10.81 |
| CBB | 15.22 | 596,913 | Cinci | Telecom Services | 89 | 15.13 |
| MAG | 18.99 | 866,979 | MAG Silver Corporation Or | Silver | 88 | 17.65 |
| TAST | 7.57 | 620,648 | Carrols Restaurant Group - Inc. | Restaurants | 86 | 6.69 |
| PRVB | 15.49 | 894,501 | Provention Bio - Inc. | Biotechnology | 83 | 13.76 |
| These stocks meet our suggested screening factors
for our Cup and Handle Chart Pattern watchlist. See Revised Rules for Trading Cup and Handle Breakouts |
||||||
| Index | Value | Change Week | Change YTD | Trend1 |
|---|---|---|---|---|
| Dow | 28606.3 |
0.07% | 0.24% | Up |
| NASDAQ | 11671.6 |
0.79% | 30.08% | Up |
| S&P 500 | 3483.81 |
0.19% | 7.83% | Up |
|
1The Market Trend is derived from
our proprietary market model. The market model is described on
the site here.
2The site also shows industry rankings based on fundamentals, combined technical and fundamentals, and on price alone. The site also shows daily industry movements. |
||||
| 1 Week | 13 Weeks | 26 Weeks | Year-to-Date |
|---|---|---|---|
| NASDAQ Composite |
NASDAQ Composite 11.12 |
NASDAQ Composite 34.93 |
NASDAQ Composite 30.08 |
| 1 Week | 3 Weeks | 13 Weeks | 26 Weeks |
|---|---|---|---|
| Solar |
Silver |
Shell Companies |
| Electrical Equipment & Parts 31 |
Electrical Equipment & Parts 37 |
Coking Coal 90 |
Residential Construction 117 |
| Charts of each industry rank and performance over 12 months are available on the site | |||
If you received this newsletter from a friend and you would like to receive it regularly please go to the BreakoutWatch.com site and you will then be able to register to receive the newsletter.
Copyright (c) 10/17/2020 NBIcharts, LLC dba BreakoutWatch.com. All
rights reserved.
" BreakoutWatch," the BreakoutWatch.com "eye" logo, and the slogan
"tomorrow's breakouts today" are service marks of NBIcharts LLC. All
other marks are the property of their respective owners, and are used
for descriptive purposes only.
BreakoutWatch is not affiliated with Investor's Business Daily or with Mr. William O'Neil. Our site, research and analysis is supported entirely by subscription and is free from advertising.