Breakoutwatch Weekly Summary 10/24/20
You are receiving this email because you are or were a
BreakoutWatch.com subscriber, or have subscribed to our weekly
newsletter. This newsletter summarizes the breakout events of the week
and provides additional guidance that does not fit into our daily
format. It is published each weekend.
Newsletter Archive: https://www.breakoutwatch.com/content/newsletters
| NASDAQ Continues in Cup and Handle
Pattern The NASDAQ Composite is moving sideways in a shallow handle. Maximum droop from pivot to handle low was 5% and for the week the index lost 1.1%. A late rally on Friday did give a hint that the index may have started to ascend the right side of the handle, but volume was well below average showing only weak support for the move. Continued failure to reach agreement on a stimulus bill means that we are unlikely to see the economy get a boost before the election. So unless there is a sudden breakthrough, or some other exogenous surprise, the markets will have little reason to change from the sideways trend. 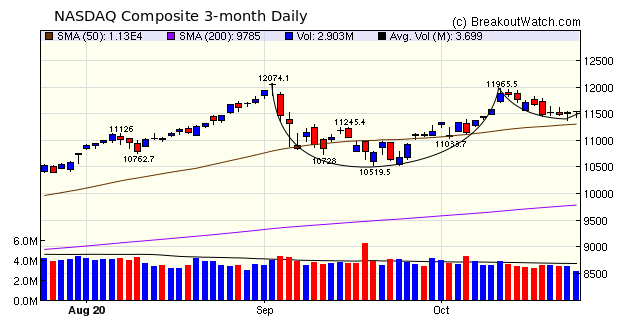 There were 2 High Tight Flag
breakouts. HTF breakouts are rare but we have seen an increasing
number over the last weeks due to the V-shaped recovery in some
stocks. Gamestop (GME) and The Container Store (TCS) are clearly
the beneficiary of the Covid shelter at home phenomenon and
increased online purchasing.
|
ChemoCentryx, Inc. [CCXI] is on our Cup and Handle watchlist and
is showing excellent handle progression with two strong up days
on above average volume since the handle low on Wednesday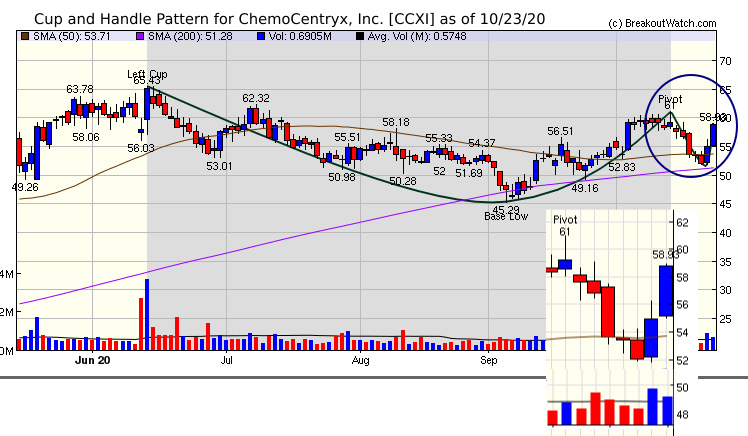 |
| No new features this week |
|
Our latest strategy
suggestions are here.
|
| List | Breakouts | Avg. Gain |
|---|---|---|
| CWH | 6 | -2.32 |
| SQZ | 1 | -1.58 |
| HTF | 2 | 1.29 |
| HSB | 0 | |
| DB | 0 |
| Brkout Date | Symbol | Base | Squeeze | Brkout Price | Brkout Day Close | RS Rank* | Last Close | Current % off BOP | Gain at Intraday High |
|---|---|---|---|---|---|---|---|---|---|
| 2020-10-21 | BCOV | CWH | n | 12.33 | 12.46 | 85 | 13.9 | 12.73% | 14.44% |
| 2020-10-23 | AIMC | CWH | n | 42.71 | 44.82 | 88 | 44.82 | 4.94% | 5.43% |
| 2020-10-20 | FIZZ | CWH | n | 85.39 | 87.39 | 90 | 87.07 | 1.97% | 9.39% |
| 2020-10-22 | GME | HTF | n | 14.80 | 14.91 | 98 | 15 | 1.35% | 7.23% |
| 2020-10-20 | TCS | HTF | n | 9.72 | 10.05 | 97 | 9.84 | 1.23% | 22.22% |
| 2020-10-22 | CNCE | CWH | n | 11.84 | 12.08 | 81 | 11.91 | 0.59% | 3.46% |
| 2020-10-19 | CREE | CWH | n | 72.90 | 73.93 | 85 | 72.53 | -0.51% | 5.87% |
| 2020-10-20 | OBCI | SQZ | y | 16.45 | 17.48 | 98 | 16.19 | -1.58% | 9.42% |
| 2020-10-19 | CYBE | CWH | n | 39.54 | 40.32 | 91 | 26.25 | -33.61% | 2.81% |
| *RS Rank on day before breakout. | |||||||||
| Symbol | BO Price |
BO Vol. |
Company | Industry | RS Rank |
Last Close |
|---|---|---|---|---|---|---|
| KIRK | 13.36 | 3,494,224 | Kirkland's - Inc. | Specialty Retail | 99 | 11.80 |
| PRTS | 13.70 | 2,666,144 | CarParts.com - Inc. | Internet Retail | 99 | 13.31 |
| ISEE | 6.61 | 1,389,472 | IVERIC bio - Inc. | Biotechnology | 97 | 6.00 |
| FUV | 7.52 | 1,275,246 | Arcimoto - Inc. | Recreational Vehicles | 96 | 6.21 |
| ICLK | 8.64 | 2,045,166 | iClick Interactive Asia Group Limited | Advertising Agencies | 95 | 8.51 |
| PSTI | 11.60 | 516,622 | Pluristem Therapeutics - Inc. | Biotechnology | 93 | 9.87 |
| GPRE | 17.38 | 672,456 | Green Plains - Inc. | Specialty Chemicals | 93 | 16.16 |
| ECOM | 18.75 | 639,750 | ChannelAdvisor Corporation | Software - Application | 92 | 18.08 |
| BLDP | 19.21 | 6,536,650 | Ballard Power Systems - Inc. | Specialty Industrial Machinery | 91 | 16.00 |
| IDT | 11.86 | 547,362 | IDT Corporation Class B | Telecom Services | 91 | 10.44 |
| These stocks meet our suggested screening factors
for our Cup and Handle Chart Pattern watchlist. See Revised Rules for Trading Cup and Handle Breakouts |
||||||
| Index | Value | Change Week | Change YTD | Trend1 |
|---|---|---|---|---|
| Dow | 28335.6 |
-0.95% | -0.71% | Up |
| NASDAQ | 11548.3 |
-1.06% | 28.71% | Up |
| S&P 500 | 3465.39 |
-0.53% | 7.26% | Up |
|
1The Market Trend is derived from
our proprietary market model. The market model is described on
the site here.
2The site also shows industry rankings based on fundamentals, combined technical and fundamentals, and on price alone. The site also shows daily industry movements. |
||||
| 1 Week | 13 Weeks | 26 Weeks | Year-to-Date |
|---|---|---|---|
| S&P 500 |
NASDAQ Composite 11.44 |
NASDAQ Composite 33.75 |
NASDAQ Composite 28.71 |
| 1 Week | 3 Weeks | 13 Weeks | 26 Weeks |
|---|---|---|---|
| Home Improvement Retail |
Silver |
Shell Companies |
| Waste Management 24 |
Auto Parts 37 |
Restaurants 85 |
Residential Construction 121 |
| Charts of each industry rank and performance over 12 months are available on the site | |||
If you received this newsletter from a friend and you would like to receive it regularly please go to the BreakoutWatch.com site and you will then be able to register to receive the newsletter.
Copyright (c) 10/24/2020 NBIcharts, LLC dba BreakoutWatch.com. All
rights reserved.
" BreakoutWatch," the BreakoutWatch.com "eye" logo, and the slogan
"tomorrow's breakouts today" are service marks of NBIcharts LLC. All
other marks are the property of their respective owners, and are used
for descriptive purposes only.
BreakoutWatch is not affiliated with Investor's Business Daily or with Mr. William O'Neil. Our site, research and analysis is supported entirely by subscription and is free from advertising.