Breakoutwatch Weekly Summary 10/31/20
You are receiving this email because you are or were a
BreakoutWatch.com subscriber, or have subscribed to our weekly
newsletter. This newsletter summarizes the breakout events of the week
and provides additional guidance that does not fit into our daily
format. It is published each weekend.
Newsletter Archive: https://www.breakoutwatch.com/content/newsletters
| Grimm Prospects on Halloween Despite the spin put on Thursday's economic numbers, which produced a one day rally, the majority of the news this week was grim and the markets sold off accordingly. The NASDAQ gave up 5.5% but actually fared better than the other two main indexes. Clearly a large stimulus is needed to help small business and the unemployed, but it is not going to happen in the near future. Covid-19 cases are rising and economies domestic and foreign are being negatively affected. There is also uncertainty about the outcome of Tuesday's election, and that uncertainty could continue for days or weeks if a clear winner does not emerge on Tuesday or very shortly after. Although in the medium term markets will recover from 1-2 months of uncertainty, the outlook for upside breakouts will be bleak. The NASDAQ has fallen 9% from its October 12 high, almost in correction territory (-10%) but a fall to at least the next support level at -12% looks likely. 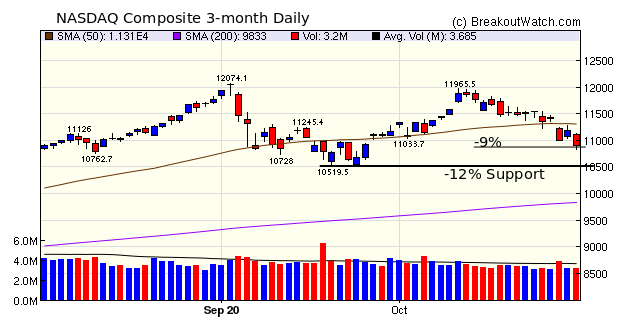 We already see the impact of the
negative trend in the performance of upside breakouts this week.
Of the eleven we counted, only 6 remained above their breakout
price by Friday's close.
|
|
Martin Marietta Materials Inc (MLM) Martin Marietta Materials (MLM) was appreciating on very strong volume, indicating considerable institutional interest, before setting a pivot on October 9. Subsequent price action in the handle was typical of the kind of profit taking expected, but in the last 2 days that strong institutional interest appears to have reappeared. The stock closed on Friday 4% below the pivot price. 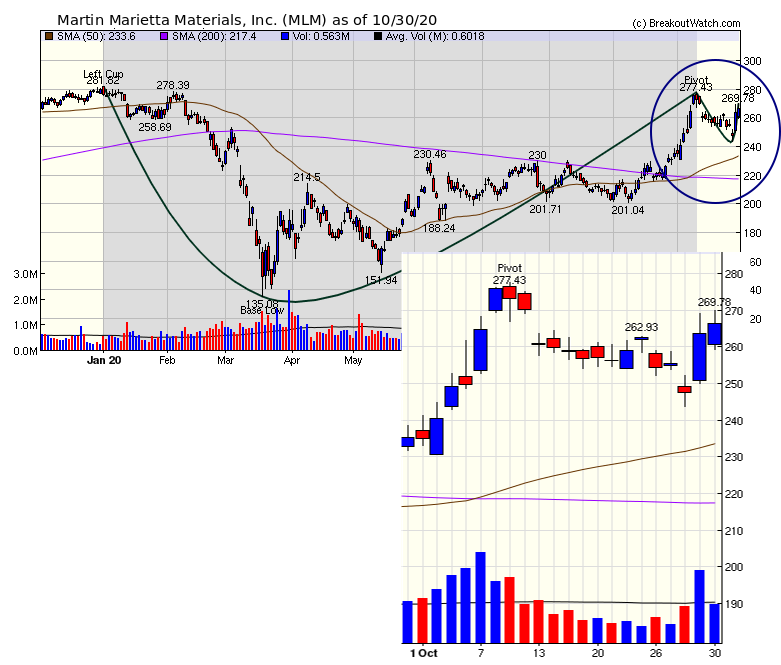 |
| No new features this week |
|
Our latest strategy
suggestions are here.
|
| List | Breakouts | Avg. Gain |
|---|---|---|
| CWH | 9 | -0.2 |
| SQZ | 2 | 4.95 |
| HTF | 0 | |
| HSB | 0 | |
| DB | 0 |
| Brkout Date | Symbol | Base | Squeeze | Brkout Price | Brkout Day Close | RS Rank* | Last Close | Current % off BOP | Gain at Intraday High |
|---|---|---|---|---|---|---|---|---|---|
| 2020-10-28 | CLGX | CWH | n | 69.57 | 76.23 | 88 | 76.93 | 10.58% | 12.76% |
| 2020-10-30 | GSHD | CWH | n | 113.41 | 122.54 | 94 | 122.54 | 8.05% | 9.52% |
| 2020-10-26 | YY | SQZ | y | 85.14 | 89.08 | 81 | 91.38 | 7.33% | 8.36% |
| 2020-10-27 | YY | SQZ | y | 89.09 | 90 | 86 | 91.38 | 2.57% | 3.56% |
| 2020-10-28 | CSV | CWH | n | 25.22 | 25.5 | 81 | 25.81 | 2.34% | 4% |
| 2020-10-30 | ALLK | CWH | n | 94.38 | 95.13 | 81 | 95.13 | 0.79% | 4.6% |
| 2020-10-29 | IQ | CWH | y | 24.75 | 25.04 | 84 | 24.7 | -0.2% | 3.54% |
| 2020-10-28 | BG | CWH | n | 57.87 | 58.06 | 80 | 56.73 | -1.97% | 4.54% |
| 2020-10-27 | VCRA | CWH | n | 33.67 | 34.51 | 92 | 32.78 | -2.64% | 9.47% |
| 2020-10-27 | MKTX | CWH | n | 572.45 | 573 | 84 | 538.85 | -5.87% | 0.52% |
| 2020-10-28 | CHWY | CWH | n | 70.72 | 72.01 | 94 | 61.6 | -12.9% | 2.57% |
| *RS Rank on day before breakout. | |||||||||
| Symbol | BO Price |
BO Vol. |
Company | Industry | RS Rank |
Last Close |
|---|---|---|---|---|---|---|
| PRTS | 14.90 | 2,641,974 | CarParts.com - Inc. | Internet Retail | 99 | 12.69 |
| ICLK | 8.64 | 1,914,668 | iClick Interactive Asia Group Limited | Advertising Agencies | 95 | 7.97 |
| IDT | 11.86 | 556,166 | IDT Corporation Class B | Telecom Services | 91 | 9.53 |
| GPRE | 17.38 | 618,392 | Green Plains - Inc. | Specialty Chemicals | 91 | 15.10 |
| EQT | 16.87 | 6,812,012 | EQT Corporation | Oil & Gas E&P | 90 | 15.14 |
| MAG | 18.99 | 810,514 | MAG Silver Corporation Or | Silver | 89 | 16.94 |
| RESI | 13.69 | 1,456,972 | Front Yard Residential Corporation | REIT - Residential | 87 | 13.39 |
| OSUR | 17.79 | 3,521,844 | OraSure Technologies - Inc. | Medical Instruments & Supplies | 85 | 14.94 |
| OLN | 18.30 | 4,617,208 | Olin Corporation | Specialty Chemicals | 83 | 16.55 |
| MAT | 14.82 | 6,319,504 | Mattel - Inc. | Leisure | 83 | 13.77 |
| These stocks meet our suggested screening factors
for our Cup and Handle Chart Pattern watchlist. See Revised Rules for Trading Cup and Handle Breakouts |
||||||
| Index | Value | Change Week | Change YTD | Trend1 |
|---|---|---|---|---|
| Dow | 26501.6 |
-6.47% | -7.14% | Down |
| NASDAQ | 10911.6 |
-5.51% | 21.61% | Down |
| S&P 500 | 3269.96 |
-5.64% | 1.21% | Down |
|
1The Market Trend is derived from
our proprietary market model. The market model is described on
the site here.
2The site also shows industry rankings based on fundamentals, combined technical and fundamentals, and on price alone. The site also shows daily industry movements. |
||||
| 1 Week | 13 Weeks | 26 Weeks | Year-to-Date |
|---|---|---|---|
| NASDAQ Composite |
NASDAQ Composite 1.55 |
NASDAQ Composite 26.81 |
NASDAQ Composite 21.61 |
| 1 Week | 3 Weeks | 13 Weeks | 26 Weeks |
|---|---|---|---|
| Utilities - Renewable |
Solar |
Shell Companies |
| Apparel Manufacturing 33 |
Apparel Manufacturing 53 |
Restaurants 89 |
Residential Construction 116 |
| Charts of each industry rank and performance over 12 months are available on the site | |||
If you received this newsletter from a friend and you would like to receive it regularly please go to the BreakoutWatch.com site and you will then be able to register to receive the newsletter.
Copyright (c) 10/31/2020 NBIcharts, LLC dba BreakoutWatch.com. All
rights reserved.
" BreakoutWatch," the BreakoutWatch.com "eye" logo, and the slogan
"tomorrow's breakouts today" are service marks of NBIcharts LLC. All
other marks are the property of their respective owners, and are used
for descriptive purposes only.
BreakoutWatch is not affiliated with Investor's Business Daily or with Mr. William O'Neil. Our site, research and analysis is supported entirely by subscription and is free from advertising.