Breakoutwatch Weekly Summary 11/07/20
You are receiving this email because you are or were a
BreakoutWatch.com subscriber, or have subscribed to our weekly
newsletter. This newsletter summarizes the breakout events of the week
and provides additional guidance that does not fit into our daily
format. It is published each weekend.
Newsletter Archive: https://www.breakoutwatch.com/content/newsletters
| Trend Indicators Turn Positive; 34
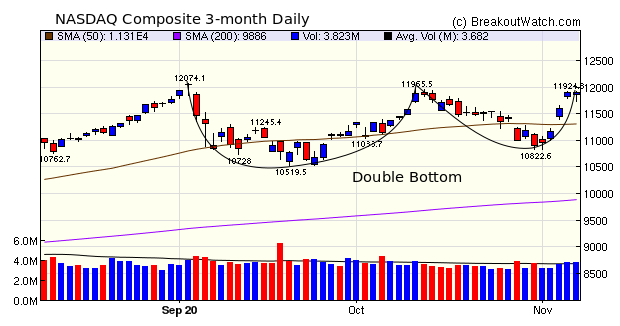
Breakouts Deliver Average 7% Gain The NASDAQ Composite gained a whopping 9% easily erasing last week's 5.5% loss. The DOW gained 6.9% and the S&P 500 7.3%. Analysts attributed the strong gains to the prospect of a divided congress which will limit major legislative changes to tax and health policy. There is also an expectation that a stimulus package will be forthcoming. The strong price move upwards accompanied by above average volume produced 34 breakouts and an average 7% gain. Cup and Handle Pattern breakouts gave the best results with an average 9% gain from 8 breakouts. The week's action leaves the NASDAQ in a bullsh Double Bottom pattern. As of Friday, Biden had not been acknowledged as President-elect and the index paused. How the markets will react nowis hard to say, but some profit taking after such a strong move higher could be expected.  |
|
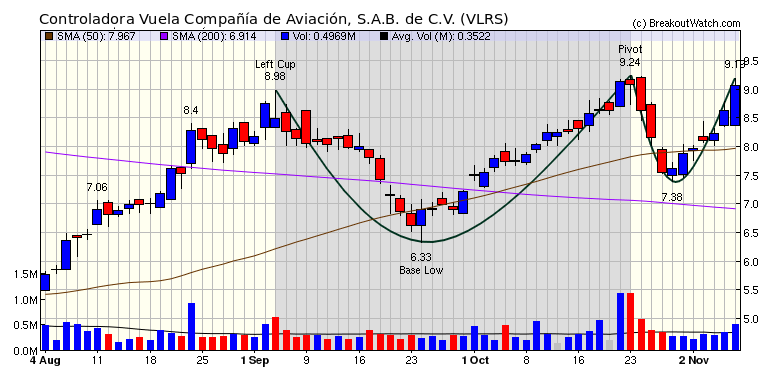
Controladora Vuela Compañía de Aviación, S.A.B. de C.V.
(VLRS) This Mexican airline is in a cup and handle pattern. Since the handle formed a low on October 29, the price has improved each day on steadily increasing volume. On Friday it gained over 5% on above average volume and looks ready to move higher next week.  |
| No new features this week |
|
Our latest strategy
suggestions are here.
|
| List | Breakouts | Avg. Gain |
|---|---|---|
| CWH | 8 | 8.97 |
| SQZ | 17 | 7.75 |
| HTF | 6 | 3.3 |
| HSB | 0 | |
| DB | 3 | 4.66 |
| Brkout Date | Symbol | Base | Squeeze | Brkout Price | Brkout Day Close | RS Rank* | Last Close | Current % off BOP | Gain at Intraday High |
|---|---|---|---|---|---|---|---|---|---|
| 2020-11-02 | FTCH | CWH | n | 30.85 | 32 | 96 | 42.48 | 37.7% | 40.97% |
| 2020-11-03 | KRTX | SQZ | y | 83.55 | 92.5 | 95 | 106.57 | 27.55% | 31.65% |
| 2020-11-06 | LASR | SQZ | y | 25.24 | 31.49 | 83 | 31.49 | 24.76% | 28.53% |
| 2020-11-06 | SHSP | SQZ | y | 11.76 | 13.56 | 86 | 13.56 | 15.31% | 16.75% |
| 2020-11-04 | ACMR | SQZ | y | 79.97 | 91 | 97 | 91.36 | 14.24% | 20.66% |
| 2020-11-05 | KNDI | SQZ | y | 8.22 | 8.92 | 92 | 9.39 | 14.23% | 21.78% |
| 2020-11-05 | MIDD | CWH | y | 109.99 | 120.75 | 80 | 122.6 | 11.46% | 12.44% |
| 2020-11-04 | GDS | CWH | y | 89.64 | 92.71 | 91 | 99.02 | 10.46% | 10.79% |
| 2020-11-04 | HEAR | SQZ | y | 18.94 | 21.01 | 92 | 20.76 | 9.61% | 21.01% |
| 2020-11-02 | ABR | SQZ | y | 11.83 | 12.76 | 84 | 12.93 | 9.3% | 11.75% |
| 2020-11-05 | YETI | CWH | n | 54.18 | 59.91 | 88 | 58.75 | 8.43% | 15.76% |
| 2020-11-05 | TRQ | HTF | n | 8.24 | 8.49 | 99 | 8.88 | 7.77% | 8.86% |
| 2020-11-05 | GRWG | CWH | n | 21.33 | 23.04 | 98 | 22.98 | 7.74% | 13.92% |
| 2020-11-05 | CPRI | SQZ | y | 23.29 | 25.27 | 84 | 24.95 | 7.13% | 11.98% |
| 2020-11-03 | RACE | DB | n | 194.37 | 196.01 | 70 | 208 | 7.01% | 7.5% |
| 2020-11-04 | KOD | HTF | n | 102.74 | 103.35 | 95 | 108.59 | 5.69% | 6.75% |
| 2020-11-02 | HRI | SQZ | y | 44.37 | 46.48 | 84 | 46.83 | 5.54% | 9.44% |
| 2020-11-05 | TRMB | DB | n | 53.29 | 55.83 | 85 | 56 | 5.09% | 9.31% |
| 2020-11-03 | MEC | SQZ | y | 9.88 | 10.18 | 88 | 10.3 | 4.25% | 8.2% |
| 2020-11-05 | JD | SQZ | y | 89.32 | 91.59 | 96 | 92.49 | 3.55% | 3.86% |
| 2020-11-04 | CGNX | SQZ | y | 70.17 | 72.65 | 81 | 72.36 | 3.12% | 6.88% |
| 2020-11-06 | SNAP | HTF | n | 44.18 | 45.38 | 97 | 45.38 | 2.72% | 3.21% |
| 2020-11-05 | ARNC | HTF | n | 24.72 | 25.36 | 88 | 25.35 | 2.55% | 5.78% |
| 2020-11-06 | TTWO | DB | n | 171.98 | 175.19 | 79 | 175.19 | 1.87% | 4.35% |
| 2020-11-06 | CMT | SQZ | y | 9.97 | 10.09 | 97 | 10.09 | 1.2% | 7.22% |
| 2020-11-03 | KAI | SQZ | y | 120.51 | 130.25 | 81 | 121.78 | 1.05% | 9.09% |
| 2020-11-03 | BKE | CWH | y | 25.08 | 26.1 | 90 | 25.29 | 0.84% | 4.7% |
| 2020-11-05 | NLS | HTF | n | 27.65 | 27.71 | 99 | 27.8 | 0.54% | 2.82% |
| 2020-11-03 | CIT | HTF | n | 31.80 | 31.88 | 86 | 31.97 | 0.53% | 2.61% |
| 2020-11-06 | TX | CWH | n | 21.63 | 21.74 | 82 | 21.74 | 0.51% | 3.42% |
| 2020-11-05 | PHAT | SQZ | y | 41.86 | 42.41 | 87 | 41.73 | -0.31% | 3.79% |
| 2020-11-05 | CGNX | SQZ | y | 72.66 | 73.9 | 82 | 72.36 | -0.41% | 3.22% |
| 2020-11-03 | OSB | CWH | n | 35.52 | 36.22 | 87 | 33.62 | -5.35% | 4.14% |
| 2020-11-04 | ZNGA | SQZ | y | 9.52 | 9.87 | 82 | 8.725 | -8.35% | 4.15% |
| *RS Rank on day before breakout. | |||||||||
| Symbol | BO Price |
BO Vol. |
Company | Industry | RS Rank |
Last Close |
|---|---|---|---|---|---|---|
| RESI | 13.69 | 1,491,327 | Front Yard Residential Corporation | REIT - Residential | 89 | 13.40 |
| ISEE | 6.61 | 1,355,436 | IVERIC bio - Inc. | Biotechnology | 88 | 6.30 |
| CBB | 15.35 | 569,102 | Cinci | Telecom Services | 88 | 15.18 |
| MOBL | 7.40 | 3,664,551 | MobileIron - Inc. | Software - Application | 87 | 7.02 |
| EQT | 16.87 | 7,200,502 | EQT Corporation | Oil & Gas E&P | 86 | 14.15 |
| GPRE | 17.38 | 619,827 | Green Plains - Inc. | Specialty Chemicals | 85 | 14.28 |
| ERIC | 12.52 | 12,471,148 | Ericsson | Communication Equipment | 83 | 12.17 |
| VLRS | 9.24 | 528,327 | Controladora Vuela Compan | Airlines | 82 | 9.06 |
| These stocks meet our suggested screening factors
for our Cup and Handle Chart Pattern watchlist. See Revised Rules for Trading Cup and Handle Breakouts |
||||||
| Index | Value | Change Week | Change YTD | Trend1 |
|---|---|---|---|---|
| Dow | 28323.4 |
6.87% | -0.75% | Up |
| NASDAQ | 11895.2 |
9.01% | 32.57% | Up |
| S&P 500 | 3509.44 |
7.32% | 8.63% | Up |
|
1The Market Trend is derived from
our proprietary market model. The market model is described on
the site here.
2The site also shows industry rankings based on fundamentals, combined technical and fundamentals, and on price alone. The site also shows daily industry movements. |
||||
| 1 Week | 13 Weeks | 26 Weeks | Year-to-Date |
|---|---|---|---|
| NASDAQ Composite |
NASDAQ Composite 8.03 |
NASDAQ Composite 30.41 |
NASDAQ Composite 32.57 |
| 1 Week | 3 Weeks | 13 Weeks | 26 Weeks |
|---|---|---|---|
| Utilities - Renewable |
Solar |
Shell Companies |
| Textile Manufacturing 31 |
Internet Retail 36 |
Steel 77 |
Furnishings, Fixtures & Appliances 109 |
| Charts of each industry rank and performance over 12 months are available on the site | |||
If you received this newsletter from a friend and you would like to receive it regularly please go to the BreakoutWatch.com site and you will then be able to register to receive the newsletter.
Copyright (c) 11/07/2020 NBIcharts, LLC dba BreakoutWatch.com. All
rights reserved.
" BreakoutWatch," the BreakoutWatch.com "eye" logo, and the slogan
"tomorrow's breakouts today" are service marks of NBIcharts LLC. All
other marks are the property of their respective owners, and are used
for descriptive purposes only.
BreakoutWatch is not affiliated with Investor's Business Daily or with Mr. William O'Neil. Our site, research and analysis is supported entirely by subscription and is free from advertising.