Breakoutwatch Weekly Summary 11/21/20
You are receiving this email because you are or were a
BreakoutWatch.com subscriber, or have subscribed to our weekly
newsletter. This newsletter summarizes the breakout events of the week
and provides additional guidance that does not fit into our daily
format. It is published each weekend.
Newsletter Archive: https://www.breakoutwatch.com/content/newsletters
| Large Cap Stocks Lose their Glamor;
Is 1.5 times ADV a Suitable Breakout Metric? The promise of at least 2 vaccines being available in the relatively near future turned traders attention to cyclical/value stocks which have been undervalued but can expect to benefit from an improving economy. Of the three major indexes, only the NASDAQ managed a small gain of 0.2%. In contrast, the Russell 2000 gained 2.4%. As can be seen in the NASDAQ chart, the index moved mostly sideways so the number of breakouts was quite restrained with only modest gains. See the Breakouts summary below. Also, see New Features for an analysis of the meaningfulness of our breakout volume metric. 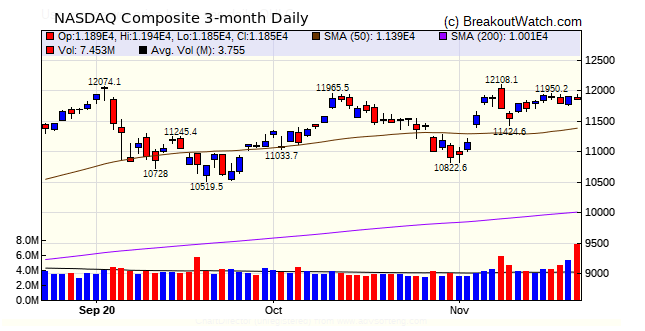 |
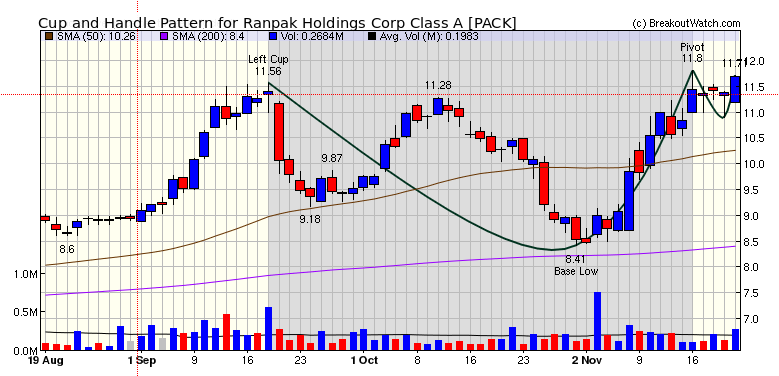 |
| Breakout Volume No Longer
Required for "Breakout" Designation Not exactly a new feature, but I'm announcing a change that I will be implementing in the next few days. In future I will not use the 'breakout volume' requirement on the Cup and Handle Pattern Watchlist, and will not report a breakout failure if the breakout volume requirement is not met. The reason for this change is explained in a paper I've written called "Is Breakout Day Volume Significant for Medium Term Success?". The paper concludes: "being focused solely on stocks that meet our 'breakout price and volume' criteria misses the vast majority of stocks that meet the breakout price but don't meet the breakout volume requirement, but nevertheless are viable candidates." There are a number of pages and reports that refer to, or use, the breakout volume criterion so it will take a few days to complete the revisions. |
|
Our latest strategy
suggestions are here.
|
| List | Breakouts | Avg. Gain |
|---|---|---|
| CWH | 3 | 0.87 |
| SQZ | 6 | 7.19 |
| HTF | 0 | |
| HSB | 0 | |
| DB | 0 |
| Brkout Date | Symbol | Base | Squeeze | Brkout Price | Brkout Day Close | RS Rank* | Last Close | Current % off BOP | Gain at Intraday High |
|---|---|---|---|---|---|---|---|---|---|
| 2020-11-18 | IPWR | SQZ | y | 6.55 | 6.6 | 94 | 7.9 | 20.61% | 32.82% |
| 2020-11-17 | VFF | CWH | n | 6.65 | 8.1 | 83 | 7.99 | 20.15% | 25.26% |
| 2020-11-18 | LMB | SQZ | y | 9.89 | 11.14 | 98 | 11.49 | 16.18% | 19.31% |
| 2020-11-18 | SOHU | SQZ | y | 19.17 | 19.45 | 91 | 19.74 | 2.97% | 5.37% |
| 2020-11-16 | SEED | SQZ | y | 9.86 | 10.18 | 82 | 10 | 1.42% | 4.06% |
| 2020-11-16 | USAK | SQZ | y | 9.66 | 10.06 | 86 | 9.78 | 1.24% | 10.77% |
| 2020-11-16 | HZN | SQZ | y | 6.83 | 7.14 | 96 | 6.88 | 0.73% | 5.12% |
| 2020-11-16 | WRK | CWH | n | 42.38 | 42.55 | 81 | 42.59 | 0.5% | 5.36% |
| 2020-11-16 | IQ | CWH | n | 27.57 | 27.77 | 82 | 22.6 | -18.03% | 1.67% |
| *RS Rank on day before breakout. | |||||||||
| Symbol | BO Price |
BO Vol. |
Company | Industry | RS Rank |
Last Close |
|---|---|---|---|---|---|---|
| PRTK | 6.33 | 855,806 | Paratek Pharmaceuticals - Inc. | Biotechnology | 91 | 6.15 |
| AMAG | 13.76 | 3,176,676 | AMAG Pharmaceuticals - Inc. | Biotechnology | 89 | 13.75 |
| RESI | 13.69 | 1,562,830 | Front Yard Residential Corporation | REIT - Residential | 87 | 13.39 |
| FSM | 8.11 | 5,508,038 | Fortuna Silver Mines Inc | Silver | 87 | 6.32 |
| CBB | 15.35 | 595,078 | Cinci | Telecom Services | 86 | 15.26 |
| SLM | 11.18 | 6,098,458 | SLM Corporation | Credit Services | 84 | 10.91 |
| OVID | 6.43 | 880,418 | Ovid Therapeutics Inc. | Biotechnology | 83 | 6.11 |
| DTIL | 10.10 | 984,148 | Precision BioSciences - Inc. | Biotechnology | 80 | 9.68 |
| These stocks meet our suggested screening factors
for our Cup and Handle Chart Pattern watchlist. See Revised Rules for Trading Cup and Handle Breakouts |
||||||
| Index | Value | Change Week | Change YTD | Trend1 |
|---|---|---|---|---|
| Dow | 29263.5 |
-0.73% | 2.54% | Up |
| NASDAQ | 11855 |
0.22% | 32.12% | Up |
| S&P 500 | 3557.54 |
-0.77% | 10.11% | Up |
|
1The Market Trend is derived from
our proprietary market model. The market model is described on
the site here.
2The site also shows industry rankings based on fundamentals, combined technical and fundamentals, and on price alone. The site also shows daily industry movements. |
||||
| 1 Week | 13 Weeks | 26 Weeks | Year-to-Date |
|---|---|---|---|
| NASDAQ Composite |
NASDAQ Composite 4.8 |
NASDAQ Composite 27.14 |
NASDAQ Composite 32.12 |
| 1 Week | 3 Weeks | 13 Weeks | 26 Weeks |
|---|---|---|---|
| Solar |
Utilities - Renewable |
Grocery Stores |
| Travel Services 67 |
Travel Services 65 |
Luxury Goods 105 |
Luxury Goods 108 |
| Charts of each industry rank and performance over 12 months are available on the site | |||
If you received this newsletter from a friend and you would like to receive it regularly please go to the BreakoutWatch.com site and you will then be able to register to receive the newsletter.
Copyright (c) 11/21/2020 NBIcharts, LLC dba BreakoutWatch.com. All
rights reserved.
" BreakoutWatch," the BreakoutWatch.com "eye" logo, and the slogan
"tomorrow's breakouts today" are service marks of NBIcharts LLC. All
other marks are the property of their respective owners, and are used
for descriptive purposes only.
BreakoutWatch is not affiliated with Investor's Business Daily or with Mr. William O'Neil. Our site, research and analysis is supported entirely by subscription and is free from advertising.