Breakoutwatch Weekly Summary 11/28/20
You are receiving this email because you are or were a
BreakoutWatch.com subscriber, or have subscribed to our weekly
newsletter. This newsletter summarizes the breakout events of the week
and provides additional guidance that does not fit into our daily
format. It is published each weekend.
Newsletter Archive: https://www.breakoutwatch.com/content/newsletters
| 79 breakouts as Indexes Set Record
Highs The NASDAQ gained 3% this week in shortened trading with the other major indexes close behind. There was plenty of good news to fuel the rally; notably the nomination of Janet Yellen to head Treasury, the release of funds for the transition and the prospects of near term distribution of Covid vaccines. 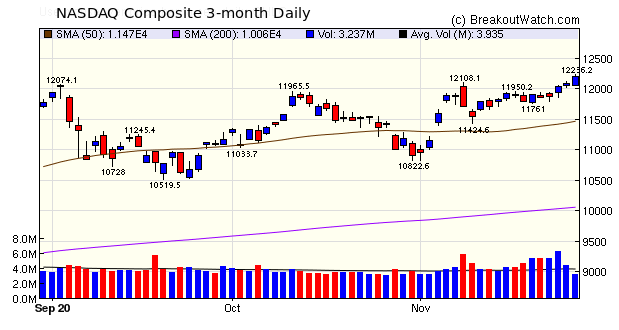 The newsletter will return to its
more lengthy form next week.
|
Profound Medical
Corp rose 1.9% on Friday on above average volume despite the
shortened trading day that generally kept volumes low. The stock
is 2.5% below the pivot point and could breakout in the coming
days.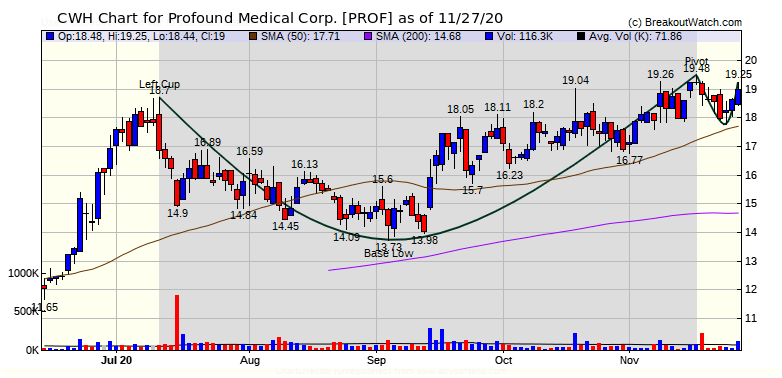 |
| No new features this week |
|
Our latest strategy
suggestions are here.
|
| List | Breakouts | Avg. Gain |
|---|---|---|
| CWH | 24 | 3.23 |
| SQZ | 54 | 8.03 |
| HTF | 1 | 4.17 |
| HSB | 0 | |
| DB | 0 |
| Brkout Date | Symbol | Base | Squeeze | Brkout Price | Brkout Day Close | RS Rank* | Last Close | Current % off BOP | Gain at Intraday High |
|---|---|---|---|---|---|---|---|---|---|
| 2020-11-23 | IDT | SQZ | y | 9.52 | 11.9 | 84 | 13.21 | 38.76% | 39.92% |
| 2020-11-24 | NVAX | SQZ | y | 93.99 | 95.33 | 99 | 125.69 | 33.73% | 40.44% |
| 2020-11-25 | NVAX | SQZ | y | 95.34 | 102.6 | 99 | 125.69 | 31.83% | 38.45% |
| 2020-11-27 | NK | SQZ | y | 7.55 | 9.67 | 95 | 9.67 | 28.08% | 29.14% |
| 2020-11-23 | ASPN | SQZ | y | 11.68 | 12 | 88 | 14.92 | 27.74% | 29.88% |
| 2020-11-24 | ASPN | SQZ | y | 12.01 | 13.15 | 90 | 14.92 | 24.23% | 26.31% |
| 2020-11-27 | NVAX | SQZ | y | 102.61 | 125.69 | 99 | 125.69 | 22.49% | 28.64% |
| 2020-11-25 | ALPN | SQZ | y | 8.30 | 9.06 | 94 | 9.84 | 18.55% | 22.05% |
| 2020-11-23 | XONE | SQZ | y | 10.85 | 11.02 | 83 | 12.71 | 17.14% | 21.11% |
| 2020-11-23 | TNP | SQZ | y | 8.02 | 9.2 | 95 | 9.23 | 15.09% | 20.82% |
| 2020-11-23 | MYOV | CWH | n | 20.61 | 21.06 | 86 | 23.53 | 14.17% | 14.8% |
| 2020-11-25 | ASPN | SQZ | y | 13.16 | 14.86 | 92 | 14.92 | 13.37% | 15.27% |
| 2020-11-23 | IGMS | SQZ | y | 60.72 | 60.91 | 88 | 67.68 | 11.46% | 11.46% |
| 2020-11-23 | LMPX | SQZ | y | 25.76 | 27.71 | 96 | 28.64 | 11.18% | 15.3% |
| 2020-11-24 | IGMS | SQZ | y | 60.92 | 62.71 | 89 | 67.68 | 11.1% | 11.1% |
| 2020-11-25 | VNET | CWH | n | 27.05 | 29.96 | 93 | 29.99 | 10.87% | 16.45% |
| 2020-11-27 | GRVY | CWH | n | 148.00 | 162.46 | 98 | 162.46 | 9.77% | 14.49% |
| 2020-11-25 | CSIQ | SQZ | y | 40.63 | 42.9 | 94 | 44.17 | 8.71% | 12.43% |
| 2020-11-23 | RUN | SQZ | y | 61.45 | 63.79 | 98 | 66.75 | 8.62% | 13% |
| 2020-11-27 | ALPN | SQZ | y | 9.07 | 9.84 | 96 | 9.84 | 8.49% | 11.69% |
| 2020-11-25 | EXPI | SQZ | y | 50.03 | 51.98 | 98 | 54.15 | 8.24% | 10.75% |
| 2020-11-23 | TLYS | CWH | n | 8.27 | 8.46 | 82 | 8.9 | 7.62% | 8.59% |
| 2020-11-27 | TXG | SQZ | y | 140.85 | 150.67 | 92 | 150.67 | 6.97% | 7.06% |
| 2020-11-25 | REGI | SQZ | y | 58.15 | 59.38 | 95 | 61.87 | 6.4% | 6.83% |
| 2020-11-23 | INFU | CWH | n | 14.97 | 15.26 | 84 | 15.89 | 6.15% | 6.88% |
| 2020-11-24 | UNFI | SQZ | y | 17.05 | 18.02 | 85 | 18.06 | 5.92% | 7.92% |
| 2020-11-23 | HZN | CWH | n | 7.18 | 7.35 | 97 | 7.6 | 5.85% | 10.72% |
| 2020-11-27 | PSNL | SQZ | y | 26.25 | 27.77 | 95 | 27.77 | 5.79% | 6.7% |
| 2020-11-23 | MORF | CWH | n | 30.36 | 30.84 | 86 | 32.08 | 5.67% | 13.5% |
| 2020-11-27 | JKS | SQZ | y | 68.52 | 72.37 | 98 | 72.37 | 5.62% | 11.79% |
| 2020-11-24 | FAT | SQZ | y | 6.01 | 6.41 | 85 | 6.34 | 5.49% | 15.09% |
| 2020-11-23 | LAD | CWH | n | 286.94 | 293.06 | 93 | 302.48 | 5.42% | 8.24% |
| 2020-11-23 | SPWH | SQZ | y | 13.86 | 14.79 | 88 | 14.6 | 5.34% | 9.6% |
| 2020-11-23 | HIBB | SQZ | y | 42.65 | 43.05 | 94 | 44.89 | 5.25% | 13.95% |
| 2020-11-27 | LAZY | SQZ | y | 15.31 | 16.03 | 96 | 16.03 | 4.7% | 8.36% |
| 2020-11-27 | XONE | SQZ | y | 12.16 | 12.71 | 87 | 12.71 | 4.52% | 8.06% |
| 2020-11-27 | NET | HTF | n | 71.77 | 74.76 | 97 | 74.76 | 4.17% | 4.4% |
| 2020-11-27 | LAC | SQZ | y | 11.07 | 11.52 | 96 | 11.52 | 4.07% | 12.74% |
| 2020-11-25 | LEU | SQZ | y | 12.07 | 13.47 | 88 | 12.55 | 3.98% | 14.5% |
| 2020-11-23 | MMSI | SQZ | y | 52.71 | 54.59 | 83 | 54.8 | 3.97% | 6.43% |
| 2020-11-23 | LBRT | CWH | n | 9.92 | 10.05 | 84 | 10.3 | 3.83% | 10.69% |
| 2020-11-24 | ONTO | CWH | n | 43.30 | 44.58 | 80 | 44.85 | 3.58% | 4.16% |
| 2020-11-23 | EQT | SQZ | y | 14.73 | 15.41 | 87 | 15.25 | 3.53% | 8.62% |
| 2020-11-23 | PRIM | CWH | n | 24.13 | 24.87 | 81 | 24.92 | 3.27% | 7.83% |
| 2020-11-27 | RDHL | SQZ | y | 8.57 | 8.85 | 82 | 8.85 | 3.27% | 5.02% |
| 2020-11-25 | TPTX | SQZ | y | 104.59 | 106.05 | 92 | 108 | 3.26% | 5.09% |
| 2020-11-27 | CSIQ | SQZ | y | 42.91 | 44.17 | 95 | 44.17 | 2.94% | 6.46% |
| 2020-11-25 | MGNX | SQZ | y | 22.42 | 22.84 | 86 | 23.07 | 2.9% | 4.91% |
| 2020-11-27 | PSTI | SQZ | y | 9.32 | 9.58 | 90 | 9.58 | 2.79% | 5.58% |
| 2020-11-25 | AMRK | SQZ | y | 29.65 | 30.22 | 96 | 30.46 | 2.73% | 3.29% |
| 2020-11-27 | SPWH | SQZ | y | 14.25 | 14.6 | 88 | 14.6 | 2.46% | 2.53% |
| 2020-11-25 | KB | CWH | n | 42.66 | 43.39 | 83 | 43.61 | 2.23% | 2.74% |
| 2020-11-25 | OCN | SQZ | y | 23.54 | 23.56 | 99 | 24 | 1.95% | 2.89% |
| 2020-11-27 | OCN | SQZ | y | 23.57 | 24 | 99 | 24 | 1.82% | 2.76% |
| 2020-11-24 | SF | CWH | n | 70.99 | 72.59 | 80 | 72.21 | 1.72% | 2.73% |
| 2020-11-25 | ALBO | SQZ | y | 35.78 | 36.95 | 86 | 36.31 | 1.48% | 6.11% |
| 2020-11-23 | AIRG | SQZ | y | 13.30 | 13.47 | 80 | 13.49 | 1.43% | 3.01% |
| 2020-11-23 | BSET | SQZ | y | 16.34 | 17.42 | 92 | 16.57 | 1.41% | 7.71% |
| 2020-11-25 | NGVC | CWH | n | 15.00 | 16.51 | 80 | 15.19 | 1.27% | 12.2% |
| 2020-11-27 | NLTX | CWH | n | 13.29 | 13.45 | 85 | 13.45 | 1.2% | 3.39% |
| 2020-11-25 | SCYX | CWH | n | 6.69 | 6.81 | 98 | 6.75 | 0.9% | 10.16% |
| 2020-11-24 | SIC | CWH | n | 7.60 | 7.84 | 85 | 7.66 | 0.79% | 5.13% |
| 2020-11-27 | AMRK | SQZ | y | 30.23 | 30.46 | 96 | 30.46 | 0.76% | 1.31% |
| 2020-11-25 | COUP | CWH | n | 324.98 | 327.53 | 88 | 326.94 | 0.6% | 2.25% |
| 2020-11-27 | BIG | SQZ | y | 52.06 | 52.34 | 91 | 52.34 | 0.54% | 2.31% |
| 2020-11-27 | TECK | CWH | n | 15.92 | 16 | 84 | 16 | 0.5% | 2.48% |
| 2020-11-24 | OPRT | CWH | n | 17.58 | 18.4 | 81 | 17.65 | 0.4% | 4.95% |
| 2020-11-27 | BBBY | SQZ | y | 21.73 | 21.8 | 95 | 21.8 | 0.32% | 1.7% |
| 2020-11-23 | LQDT | SQZ | y | 9.55 | 9.62 | 90 | 9.57 | 0.21% | 4.61% |
| 2020-11-27 | MTSI | CWH | n | 44.70 | 44.78 | 85 | 44.78 | 0.18% | 1.96% |
| 2020-11-24 | NAV | SQZ | y | 43.98 | 44 | 85 | 44.06 | 0.18% | 0.18% |
| 2020-11-25 | OMI | SQZ | y | 25.12 | 25.13 | 97 | 24.91 | -0.84% | 2.44% |
| 2020-11-24 | EQT | SQZ | y | 15.42 | 15.97 | 88 | 15.25 | -1.1% | 3.76% |
| 2020-11-25 | FAT | SQZ | y | 6.42 | 6.75 | 90 | 6.34 | -1.25% | 7.74% |
| 2020-11-24 | WRK | CWH | n | 44.65 | 45.43 | 85 | 44.06 | -1.32% | 2.08% |
| 2020-11-25 | LQDT | SQZ | y | 9.77 | 9.9 | 90 | 9.57 | -2.05% | 2.25% |
| 2020-11-25 | ITCI | SQZ | y | 25.52 | 25.59 | 88 | 24.98 | -2.12% | 2.16% |
| 2020-11-24 | SAH | CWH | n | 43.86 | 45.05 | 81 | 42.36 | -3.42% | 3.65% |
| 2020-11-24 | FBNC | CWH | n | 34.23 | 34.31 | 82 | 32.97 | -3.68% | 1.59% |
| *RS Rank on day before breakout. | |||||||||
| Symbol | BO Price |
BO Vol. |
Company | Industry | RS Rank |
Last Close |
|---|---|---|---|---|---|---|
| MRNS | 16.27 | 1,423,804 | Marinus Pharmaceuticals - Inc. | Biotechnology | 99 | 14.64 |
| GNMK | 14.45 | 1,467,530 | GenMark Diagnostics - Inc. | Medical Devices | 93 | 12.95 |
| LBRT | 10.98 | 1,397,012 | Liberty Oilfield Services Inc. | Oil & Gas Equipment & Services | 89 | 10.30 |
| SDC | 12.60 | 9,108,366 | SmileDirectClub - Inc. | Medical Devices | 88 | 12.18 |
| CENX | 10.86 | 1,444,680 | Century Aluminum Company | Aluminum | 87 | 10.40 |
| PRTK | 6.34 | 624,666 | Paratek Pharmaceuticals - Inc. | Biotechnology | 87 | 6.20 |
| TIGR | 7.41 | 1,443,198 | UP Fintech Holding Limited | Capital Markets | 86 | 6.24 |
| OVID | 6.43 | 852,740 | Ovid Therapeutics Inc. | Biotechnology | 84 | 6.29 |
| CRON | 8.81 | 7,963,358 | Cronos Group Inc. | Drug Manufacturers - Specialty & Generic | 84 | 8.47 |
| MESO | 17.39 | 859,509 | Mesoblast Limited | Biotechnology | 83 | 14.93 |
| These stocks meet our suggested screening factors
for our Cup and Handle Chart Pattern watchlist. See Revised Rules for Trading Cup and Handle Breakouts |
||||||
| Index | Value | Change Week | Change YTD | Trend1 |
|---|---|---|---|---|
| Dow | 29910.4 |
2.21% | 4.81% | Up |
| NASDAQ | 12205.8 |
2.96% | 36.03% | Up |
| S&P 500 | 3638.35 |
2.27% | 12.62% | Up |
|
1The Market Trend is derived from
our proprietary market model. The market model is described on
the site here.
2The site also shows industry rankings based on fundamentals, combined technical and fundamentals, and on price alone. The site also shows daily industry movements. |
||||
| 1 Week | 13 Weeks | 26 Weeks | Year-to-Date |
|---|---|---|---|
| NASDAQ Composite |
Dow Jones 4.36 |
NASDAQ Composite 28.62 |
NASDAQ Composite 36.03 |
| 1 Week | 3 Weeks | 13 Weeks | 26 Weeks |
|---|---|---|---|
| Solar |
Utilities - Renewable |
Grocery Stores |
| Agricultural Inputs 50 |
Aluminum 88 |
Luxury Goods 119 |
Luxury Goods 125 |
| Charts of each industry rank and performance over 12 months are available on the site | |||
If you received this newsletter from a friend and you would like to receive it regularly please go to the BreakoutWatch.com site and you will then be able to register to receive the newsletter.
Copyright (c) 11/28/2020 NBIcharts, LLC dba BreakoutWatch.com. All
rights reserved.
" BreakoutWatch," the BreakoutWatch.com "eye" logo, and the slogan
"tomorrow's breakouts today" are service marks of NBIcharts LLC. All
other marks are the property of their respective owners, and are used
for descriptive purposes only.
BreakoutWatch is not affiliated with Investor's Business Daily or with Mr. William O'Neil. Our site, research and analysis is supported entirely by subscription and is free from advertising.