Breakoutwatch Weekly Summary 01/02/21
You are receiving this email because you are or were a
BreakoutWatch.com subscriber, or have subscribed to our weekly
newsletter. This newsletter summarizes the breakout events of the week
and provides additional guidance that does not fit into our daily
format. It is published each weekend.
Newsletter Archive: https://www.breakoutwatch.com/content/newsletters
| Major indexes Set New Highs; 32 Cup
and Handle Breakouts Avg. 11.8% for year The year ended on a high note with the major indexes setting new highs on Tuesday. By Wednesday it became doubtful the $2,000 Covid stimulus checks would materialize and the vaccine inoculation numbers would fall well short of the Administration's promises. Neither of these had a significant effect and the NASDAQ close with a gain of 0.65% for the week. For the year, the NASDAQ gained an amazing 43.6%. 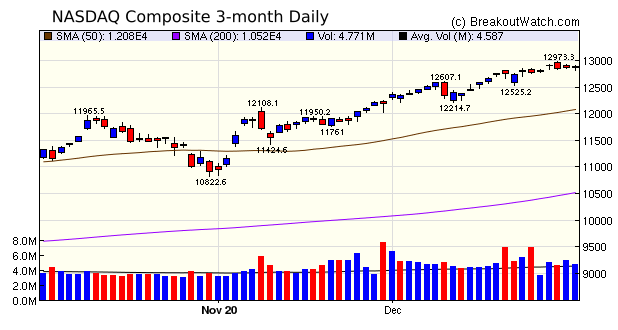 Breakouts were down in numbers from
last week at 32 vs. 41 and average gains of 1.5% vs. 3%.
For the year, there were 16,004 cup
and handle breakouts (meaning they closed higher than their
breakout price on the first day after being on the watchlist)
for an average gain of 11.8%.
|
This feature will return next week. |
| No new features this week |
|
Our latest strategy
suggestions are here.
If you are a new subscriber you
may not have seen news of our new breakout prediction model.
The results are printed daily in the Daily Report. You can
learn about it in the newsletter
of 12/05/20.
|
| List | Breakouts | Avg. Gain |
|---|---|---|
| CWH | 5 | 1.92 |
| SQZ | 24 | 1.6 |
| HTF | 3 | 0.17 |
| HSB | 0 | |
| DB | 0 |
| Brkout Date | Symbol | Base | Squeeze | Brkout Price | Brkout Day Close | RS Rank* | Last Close | Current % off BOP | Gain at Intraday High |
|---|---|---|---|---|---|---|---|---|---|
| 2020-12-31 | IMAB | CWH | n | 43.50 | 47.15 | 84 | 47.15 | 8.39% | 8.39% |
| 2020-12-31 | FRG | SQZ | y | 28.92 | 30.45 | 83 | 30.45 | 5.29% | 6.33% |
| 2020-12-30 | GPI | SQZ | y | 125.19 | 129.84 | 87 | 131.14 | 4.75% | 6.54% |
| 2020-12-28 | LAZY | SQZ | y | 15.56 | 15.74 | 96 | 16.25 | 4.43% | 6.14% |
| 2020-12-31 | RM | SQZ | y | 28.82 | 29.86 | 82 | 29.86 | 3.61% | 5.73% |
| 2020-12-28 | ORBC | HTF | n | 7.18 | 7.33 | 94 | 7.42 | 3.34% | 11.42% |
| 2020-12-31 | BRP | SQZ | y | 29.04 | 29.97 | 85 | 29.97 | 3.2% | 3.41% |
| 2020-12-29 | LAZY | SQZ | y | 15.75 | 15.91 | 96 | 16.25 | 3.17% | 3.43% |
| 2020-12-31 | AVTR | SQZ | y | 27.35 | 28.15 | 81 | 28.15 | 2.93% | 3.14% |
| 2020-12-28 | UAN | HTF | n | 15.60 | 15.73 | 99 | 16.02 | 2.69% | 5.96% |
| 2020-12-28 | ODP | SQZ | y | 28.64 | 29.69 | 99 | 29.3 | 2.3% | 8.17% |
| 2020-12-31 | EBIX | SQZ | y | 37.18 | 37.97 | 86 | 37.97 | 2.12% | 2.8% |
| 2020-12-30 | LAZY | SQZ | y | 15.92 | 15.99 | 97 | 16.25 | 2.07% | 2.32% |
| 2020-12-31 | SGC | SQZ | y | 22.77 | 23.24 | 81 | 23.24 | 2.06% | 4.17% |
| 2020-12-29 | DKL | CWH | n | 31.55 | 31.65 | 85 | 32 | 1.43% | 2.88% |
| 2020-12-29 | LOGI | CWH | n | 95.94 | 96.3 | 84 | 97.19 | 1.3% | 2.47% |
| 2020-12-31 | SEAS | SQZ | y | 31.20 | 31.59 | 87 | 31.59 | 1.25% | 2.47% |
| 2020-12-30 | DKL | SQZ | y | 31.66 | 31.79 | 87 | 32 | 1.07% | 2.39% |
| 2020-12-31 | GPI | SQZ | y | 129.85 | 131.14 | 88 | 131.14 | 0.99% | 2.72% |
| 2020-12-31 | HOME | SQZ | y | 15.32 | 15.46 | 96 | 15.46 | 0.91% | 1.5% |
| 2020-12-31 | NIO | SQZ | y | 48.39 | 48.74 | 99 | 48.74 | 0.72% | 4.36% |
| 2020-12-31 | DKL | SQZ | y | 31.80 | 32 | 86 | 32 | 0.63% | 0.63% |
| 2020-12-31 | NNBR | SQZ | y | 6.53 | 6.57 | 83 | 6.57 | 0.61% | 3.83% |
| 2020-12-31 | CHUY | SQZ | y | 26.36 | 26.49 | 83 | 26.49 | 0.49% | 1.71% |
| 2020-12-31 | KALV | SQZ | y | 18.90 | 18.99 | 83 | 18.99 | 0.48% | 1.69% |
| 2020-12-31 | CIR | SQZ | y | 38.27 | 38.44 | 84 | 38.44 | 0.44% | 2.77% |
| 2020-12-31 | MPWR | CWH | n | 365.03 | 366.23 | 84 | 366.23 | 0.33% | 0.55% |
| 2020-12-31 | ABR | SQZ | y | 14.14 | 14.18 | 82 | 14.18 | 0.28% | 0.71% |
| 2020-12-31 | VAC | SQZ | y | 137.20 | 137.22 | 83 | 137.22 | 0.01% | 1.63% |
| 2020-12-30 | ICLK | CWH | n | 8.70 | 8.73 | 86 | 8.54 | -1.84% | 4.6% |
| 2020-12-29 | OBCI | SQZ | y | 14.13 | 14.41 | 91 | 13.36 | -5.45% | 3.75% |
| 2020-12-29 | FFHL | HTF | n | 12.50 | 12.99 | 97 | 11.81 | -5.52% | 8.82% |
| *RS Rank on day before breakout. | |||||||||
| Symbol | BO Price |
BO Vol. |
Company | Industry | RS Rank |
Last Close |
|---|---|---|---|---|---|---|
| GNMK | 15.68 | 1,097,685 | GenMark Diagnostics - Inc. | Medical Devices | 90 | 14.60 |
| SPWH | 18.08 | 2,535,192 | Sportsman's Warehouse Holdings - Inc. | Leisure | 86 | 17.55 |
| SSL | 9.70 | 1,644,100 | Sasol Ltd. American Depos | Oil & Gas Integrated | 84 | 8.86 |
| TEN | 11.69 | 1,523,490 | Tenneco Inc. | Auto Parts | 83 | 10.60 |
| APA | 16.86 | 17,155,767 | Apache Corporation | Oil & Gas E&P | 83 | 14.19 |
| WPX | 8.62 | 11,218,672 | WPX Energy - Inc. | Oil & Gas E&P | 83 | 8.15 |
| SLM | 12.55 | 5,293,288 | SLM Corporation | Credit Services | 81 | 12.39 |
| These stocks meet our suggested screening factors
for our Cup and Handle Chart Pattern watchlist. See Revised Rules for Trading Cup and Handle Breakouts |
||||||
| Index | Value | Change Week | Change YTD | Trend1 |
|---|---|---|---|---|
| Dow | 30606.5 |
1.35% | 7.25% | Up |
| NASDAQ | 12888.3 |
0.65% | 43.64% | Up |
| S&P 500 | 3756.07 |
1.43% | 16.26% | Up |
|
1The Market Trend is derived from
our proprietary market model. The market model is described on
the site here.
2The site also shows industry rankings based on fundamentals, combined technical and fundamentals, and on price alone. The site also shows daily industry movements. |
||||
| 1 Week | 13 Weeks | 26 Weeks | Year-to-Date |
|---|---|---|---|
| S&P 500 |
NASDAQ Composite 13.79 |
NASDAQ Composite 26.26 |
NASDAQ Composite 43.64 |
| 1 Week | 3 Weeks | 13 Weeks | 26 Weeks |
|---|---|---|---|
| Uranium |
Solar |
Silver |
| Solar 107 |
Uranium 95 |
Aluminum 125 |
Textile Manufacturing 133 |
| Charts of each industry rank and performance over 12 months are available on the site | |||
If you received this newsletter from a friend and you would like to receive it regularly please go to the BreakoutWatch.com site and you will then be able to register to receive the newsletter.
Copyright (c) 01/02/2021 NBIcharts, LLC dba BreakoutWatch.com. All
rights reserved.
" BreakoutWatch," the BreakoutWatch.com "eye" logo, and the slogan
"tomorrow's breakouts today" are service marks of NBIcharts LLC. All
other marks are the property of their respective owners, and are used
for descriptive purposes only.
BreakoutWatch is not affiliated with Investor's Business Daily or with Mr. William O'Neil. Our site, research and analysis is supported entirely by subscription and is free from advertising.