Breakoutwatch Weekly Summary 02/06/21
You are receiving this email because you are or were a
BreakoutWatch.com subscriber, or have subscribed to our weekly
newsletter. This newsletter summarizes the breakout events of the week
and provides additional guidance that does not fit into our daily
format. It is published each weekend.
Newsletter Archive: https://www.breakoutwatch.com/content/newsletters
| Breakouts gain 7.8% on Average;
Stocks Likely to Breakout Tutorial Traders bought last week's dip and the markets again set new highs. The NASDAQ closed higher in each session delivering a 6% gain for the week. It is clear now that the Biden Covid rescue and stimulus plan will be passed using 'reconciliation', which will ensure that the majority of the 1.9T package will pass and the bull market will continue, barring any external shocks. Fourth quarter earnings were strong, exceeding analysts estimates in aggregate by 15%, so with further stimulus, and vaccination allowing economic activity to improve, the markets are expecting earnings strength to continue. 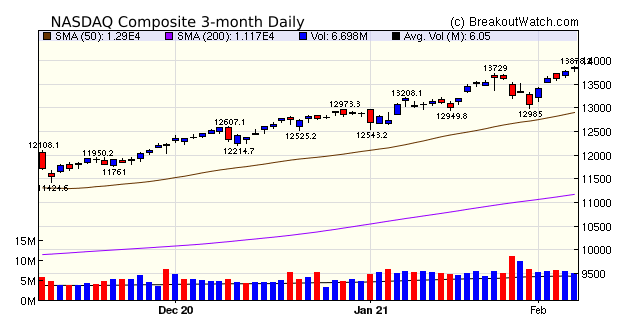 Cup and Handle breakouts (10)
averaged an 8.8% gain and Volatility Squeeze breakouts (58) did
almost as well with an average 0f 7% gain. There were a
surprising number of HTF breakouts (7) with a stellar 14%
average gain. Readers of How to Make Money in Stocks will recall
that this pattern is considered rare, but capable of giving
strong gains.
|
The Trade Desk
(TTD) is on our list of stocks most likely to breakout out on
Monday. I like it because it has 9% to improve before hitting
resistance at the left cup level, although I would prefer a
longer, deeper handle and above average volume in Friday's
trading. Read how I would play this, and other stocks on our
"Likely to Close above BoP at Next Session" list below.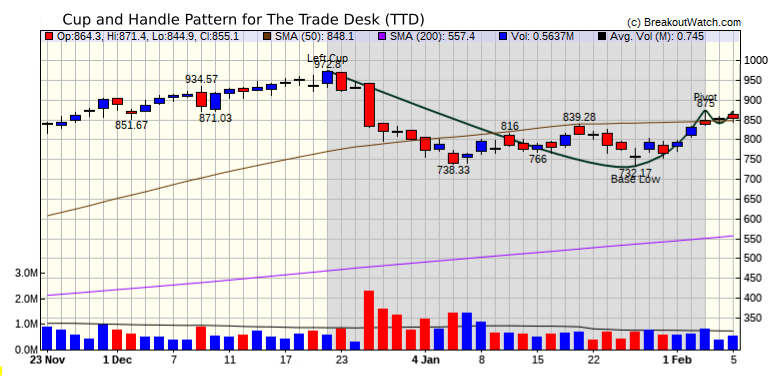 |
| No new features this week |
|
Our latest strategy
suggestions are here.
How to Trade Stocks "Likely to
Close above BoP at Next Session"
Here is the list for Friday 2/05
for trading on 2/07
Every day we use our price model
to select stocks likely to close above their breakout price at
the next session. See our 12/19/20
newsletter for a brief tutorial. I don't monitor the
market in real time waiting for alerts, so here's how I play
stocks on the list.
1. Go to the
Daily Report on the website
https://www.breakoutwatch.com/content/daily-reports
2. Click
through the symbols to see the cup and handle pattern for each
stock
3. Pick one or
more stocks on the list to trade at the next session
4. Place a
market stop order at the breakout price. If the price rises to
the breakout price, the stock will be bought and if not you
are not out of pocket.
5. If you
bought the stock, but it closes below BoP, sell at the next
open.
6. If the
stock closes above BoP, set a trailing stop using the Trailing
Stop Calculator and adjust it each day.
|
||||||||||||||||||||||||||||||||||||||||||
| List | Breakouts | Avg. Gain |
|---|---|---|
| CWH | 10 | 8.84 |
| SQZ | 58 | 7.03 |
| HTF | 7 | 13.78 |
| HSB | 0 | |
| DB | 2 | 5.39 |
| Brkout Date | Symbol | Base | Squeeze | Brkout Price | Brkout Day Close | RS Rank* | Last Close | Current % off BOP | Gain at Intraday High |
|---|---|---|---|---|---|---|---|---|---|
| 2021-02-01 | AVNW | CWH | n | 39.50 | 41.97 | 93 | 54.75 | 38.61% | 46.81% |
| 2021-02-02 | PERI | SQZ | y | 15.08 | 15.23 | 93 | 20.43 | 35.48% | 36.67% |
| 2021-02-03 | PERI | SQZ | y | 15.24 | 15.55 | 93 | 20.43 | 34.06% | 35.24% |
| 2021-02-04 | PERI | SQZ | y | 15.56 | 16.74 | 92 | 20.43 | 31.3% | 32.46% |
| 2021-02-03 | PLSE | HTF | n | 35.99 | 36.62 | 95 | 44.15 | 22.67% | 23.34% |
| 2021-02-05 | PERI | SQZ | y | 16.75 | 20.43 | 93 | 20.43 | 21.97% | 23.04% |
| 2021-02-01 | FVE | SQZ | y | 7.24 | 7.73 | 84 | 8.66 | 19.61% | 20.17% |
| 2021-02-02 | APHA | HTF | n | 14.01 | 14.74 | 95 | 16.67 | 18.99% | 24.88% |
| 2021-02-04 | VJET | HTF | n | 18.90 | 19.3 | 93 | 22.43 | 18.68% | 21.16% |
| 2021-02-02 | IDT | CWH | n | 14.90 | 15.28 | 88 | 17.62 | 18.26% | 21.99% |
| 2021-02-03 | REKR | HTF | n | 13.70 | 14.77 | 95 | 16.04 | 17.08% | 25.33% |
| 2021-02-01 | FPRX | SQZ | y | 16.73 | 16.75 | 97 | 19.41 | 16.02% | 16.86% |
| 2021-02-02 | FPRX | SQZ | y | 16.76 | 17.77 | 97 | 19.41 | 15.81% | 16.65% |
| 2021-02-03 | SSL | CWH | n | 11.61 | 12.93 | 83 | 13.39 | 15.33% | 15.76% |
| 2021-02-04 | DMTK | HTF | n | 47.13 | 49.24 | 96 | 54.17 | 14.94% | 18.25% |
| 2021-02-04 | PRTK | SQZ | y | 6.96 | 7.57 | 81 | 7.86 | 12.93% | 15.42% |
| 2021-02-02 | FREQ | SQZ | y | 44.72 | 47.46 | 91 | 50.46 | 12.84% | 13.8% |
| 2021-02-04 | FAT | SQZ | y | 7.46 | 7.82 | 83 | 8.35 | 11.93% | 15.73% |
| 2021-02-02 | FVE | SQZ | y | 7.74 | 7.83 | 85 | 8.66 | 11.89% | 12.4% |
| 2021-02-02 | RARE | SQZ | y | 145.64 | 153.15 | 88 | 162.22 | 11.38% | 12.01% |
| 2021-02-02 | BL | SQZ | y | 133.73 | 138.79 | 83 | 148.51 | 11.05% | 11.16% |
| 2021-02-03 | DLTH | SQZ | y | 13.22 | 14.05 | 81 | 14.63 | 10.67% | 12.44% |
| 2021-02-02 | RYAM | SQZ | y | 7.44 | 7.98 | 95 | 8.2 | 10.22% | 20.3% |
| 2021-02-04 | VERU | SQZ | y | 9.90 | 14.28 | 96 | 10.895 | 10.05% | 47.37% |
| 2021-02-04 | AEYE | DB | y | 26.98 | 29.65 | 93 | 29.6 | 9.71% | 13.23% |
| 2021-02-02 | ATLC | SQZ | y | 27.29 | 28.5 | 92 | 29.88 | 9.49% | 10.3% |
| 2021-02-03 | SOLO | SQZ | y | 8.02 | 8.13 | 97 | 8.69 | 8.35% | 21.45% |
| 2021-02-01 | QFIN | CWH | n | 18.38 | 18.51 | 83 | 19.91 | 8.32% | 10.99% |
| 2021-02-04 | BL | SQZ | y | 137.26 | 142.89 | 83 | 148.51 | 8.2% | 8.3% |
| 2021-02-03 | JOE | SQZ | y | 49.51 | 50.32 | 91 | 53.41 | 7.88% | 8.02% |
| 2021-02-05 | ARWR | SQZ | y | 83.93 | 90.47 | 83 | 90.47 | 7.79% | 9.25% |
| 2021-02-04 | SOLO | SQZ | y | 8.14 | 9.48 | 97 | 8.69 | 6.76% | 19.66% |
| 2021-02-04 | HZN | SQZ | y | 9.34 | 9.57 | 93 | 9.96 | 6.64% | 7.39% |
| 2021-02-04 | CLDX | CWH | n | 22.43 | 23.09 | 98 | 23.8 | 6.11% | 13.95% |
| 2021-02-05 | FVE | CWH | y | 8.17 | 8.66 | 86 | 8.66 | 6% | 6.49% |
| 2021-02-02 | ALTM | SQZ | y | 51.67 | 51.74 | 97 | 54.76 | 5.98% | 7.41% |
| 2021-02-03 | FTCH | SQZ | y | 62.94 | 67 | 96 | 66.51 | 5.67% | 10.35% |
| 2021-02-04 | EVRI | SQZ | y | 14.42 | 14.83 | 87 | 15.21 | 5.48% | 6.66% |
| 2021-02-02 | AZUL | SQZ | y | 22.89 | 23.5 | 85 | 24.14 | 5.46% | 6.86% |
| 2021-02-04 | MCRB | SQZ | y | 25.76 | 26.34 | 97 | 27.04 | 4.97% | 7.73% |
| 2021-02-03 | ATLC | SQZ | y | 28.51 | 29.53 | 92 | 29.88 | 4.81% | 5.58% |
| 2021-02-05 | AIRT | SQZ | y | 22.61 | 23.61 | 84 | 23.61 | 4.42% | 6.02% |
| 2021-02-02 | VLRS | SQZ | y | 12.07 | 12.18 | 83 | 12.6 | 4.39% | 5.97% |
| 2021-02-05 | LPI | HTF | n | 28.66 | 29.9 | 88 | 29.9 | 4.33% | 5.37% |
| 2021-02-04 | ALLK | SQZ | y | 138.29 | 141.6 | 83 | 144.14 | 4.23% | 4.23% |
| 2021-02-04 | DLTH | SQZ | y | 14.06 | 14.1 | 84 | 14.63 | 4.05% | 5.73% |
| 2021-02-05 | HZN | SQZ | y | 9.58 | 9.96 | 94 | 9.96 | 3.97% | 4.7% |
| 2021-02-03 | MN | SQZ | y | 6.29 | 6.45 | 88 | 6.51 | 3.5% | 5.72% |
| 2021-02-02 | SAIL | SQZ | y | 57.21 | 58.99 | 88 | 59.13 | 3.36% | 6.61% |
| 2021-02-04 | MESA | SQZ | y | 6.93 | 7.21 | 83 | 7.13 | 2.89% | 6.2% |
| 2021-02-05 | MCRB | SQZ | y | 26.35 | 27.04 | 97 | 27.04 | 2.62% | 5.31% |
| 2021-02-04 | VLRS | SQZ | y | 12.28 | 12.5 | 83 | 12.6 | 2.61% | 4.15% |
| 2021-02-01 | WORK | SQZ | y | 42.18 | 42.51 | 83 | 43.24 | 2.51% | 2.73% |
| 2021-02-05 | NSYS | SQZ | y | 8.09 | 8.27 | 85 | 8.27 | 2.22% | 3.08% |
| 2021-02-05 | RHP | SQZ | y | 69.01 | 70.38 | 80 | 70.38 | 1.99% | 2.95% |
| 2021-02-05 | ALLK | SQZ | y | 141.61 | 144.14 | 83 | 144.14 | 1.79% | 1.79% |
| 2021-02-02 | WORK | SQZ | y | 42.52 | 42.73 | 82 | 43.24 | 1.69% | 1.9% |
| 2021-02-03 | MGNX | SQZ | y | 22.51 | 23.13 | 84 | 22.86 | 1.55% | 6.18% |
| 2021-02-05 | NBR | CWH | n | 77.21 | 78.12 | 93 | 78.12 | 1.18% | 2.32% |
| 2021-02-03 | WORK | SQZ | y | 42.74 | 43.04 | 82 | 43.24 | 1.17% | 1.38% |
| 2021-02-02 | HCAP | SQZ | y | 7.83 | 7.91 | 88 | 7.92 | 1.15% | 2.17% |
| 2021-02-05 | XOMA | SQZ | y | 43.34 | 43.83 | 85 | 43.83 | 1.13% | 1.45% |
| 2021-02-04 | VER | DB | y | 36.89 | 37.16 | 98 | 37.28 | 1.06% | 1.57% |
| 2021-02-04 | MN | SQZ | y | 6.46 | 6.48 | 90 | 6.51 | 0.77% | 2.94% |
| 2021-02-05 | VLRS | SQZ | y | 12.51 | 12.6 | 83 | 12.6 | 0.72% | 1.28% |
| 2021-02-04 | PK | SQZ | y | 18.08 | 18.11 | 82 | 18.15 | 0.39% | 3.54% |
| 2021-02-05 | VER | SQZ | y | 37.17 | 37.28 | 98 | 37.28 | 0.3% | 0.81% |
| 2021-02-05 | PK | SQZ | y | 18.12 | 18.15 | 81 | 18.15 | 0.17% | 2.98% |
| 2021-02-04 | HCAP | CWH | n | 7.92 | 7.93 | 89 | 7.92 | 0% | 1.01% |
| 2021-02-03 | AI | SQZ | y | 146.89 | 147.05 | 99 | 146.6 | -0.2% | 7.75% |
| 2021-02-03 | HEXO | HTF | n | 7.82 | 7.93 | 94 | 7.8 | -0.26% | 4.48% |
| 2021-02-04 | AI | SQZ | y | 147.06 | 154.37 | 99 | 146.6 | -0.31% | 7.62% |
| 2021-02-04 | FTCH | SQZ | y | 67.01 | 67.13 | 96 | 66.51 | -0.75% | 3.64% |
| 2021-02-01 | NLS | CWH | n | 25.18 | 26.58 | 96 | 24.79 | -1.55% | 9.41% |
| 2021-02-04 | CPA | SQZ | y | 81.94 | 82.93 | 80 | 79.7 | -2.73% | 4.47% |
| 2021-02-03 | ACB | CWH | n | 13.32 | 13.75 | 83 | 12.8 | -3.9% | 6.23% |
| 2021-02-01 | AHCO | SQZ | y | 38.28 | 40.15 | 90 | 35.74 | -6.64% | 8.62% |
| *RS Rank on day before breakout. | |||||||||
| Symbol | BO Price |
BO Vol. |
Company | Industry | RS Rank |
Last Close |
|---|---|---|---|---|---|---|
| WYY | 14.99 | 778,110 | WidePoint Corporation | Information Technology Services | 99 | 13.10 |
| CYH | 11.45 | 3,093,798 | Community Health Systems - Inc. | Medical Care Facilities | 83 | 9.22 |
| These stocks meet our suggested screening factors
for our Cup and Handle Chart Pattern watchlist. See Revised Rules for Trading Cup and Handle Breakouts |
||||||
| Index | Value | Change Week | Change YTD | Trend1 |
|---|---|---|---|---|
| Dow | 31148.2 |
3.89% | 1.77% | Up |
| NASDAQ | 13856.3 |
6.01% | 7.51% | Up |
| S&P 500 | 3886.83 |
4.65% | 3.48% | Up |
|
1The Market Trend is derived from
our proprietary market model. The market model is described on
the site here.
2The site also shows industry rankings based on fundamentals, combined technical and fundamentals, and on price alone. The site also shows daily industry movements. |
||||
| 1 Week | 13 Weeks | 26 Weeks | Year-to-Date |
|---|---|---|---|
| NASDAQ Composite |
NASDAQ Composite 16.49 |
NASDAQ Composite 25.84 |
NASDAQ Composite 7.51 |
| 1 Week | 3 Weeks | 13 Weeks | 26 Weeks |
|---|---|---|---|
| Luxury Goods |
Uranium |
Silver |
| Silver 50 |
Internet Retail 46 |
Department Stores 130 |
Department Stores 136 |
| Charts of each industry rank and performance over 12 months are available on the site | |||
If you received this newsletter from a friend and you would like to receive it regularly please go to the BreakoutWatch.com site and you will then be able to register to receive the newsletter.
Copyright (c) 02/06/2021 NBIcharts, LLC dba BreakoutWatch.com. All
rights reserved.
" BreakoutWatch," the BreakoutWatch.com "eye" logo, and the slogan
"tomorrow's breakouts today" are service marks of NBIcharts LLC. All
other marks are the property of their respective owners, and are used
for descriptive purposes only.
BreakoutWatch is not affiliated with Investor's Business Daily or with Mr. William O'Neil. Our site, research and analysis is supported entirely by subscription and is free from advertising.