Breakoutwatch Weekly Summary 02/13/21
You are receiving this email because you are or were a
BreakoutWatch.com subscriber, or have subscribed to our weekly
newsletter. This newsletter summarizes the breakout events of the week
and provides additional guidance that does not fit into our daily
format. It is published each weekend.
Newsletter Archive: https://www.breakoutwatch.com/content/newsletters
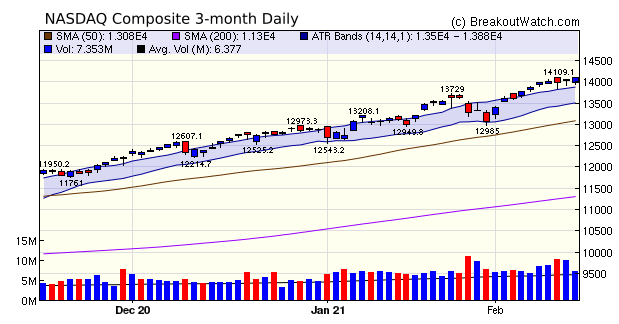
| HTF Alerts gain an Average of 13% The NASDAQ Composite started the week strongly but then moved more laterally as the index consolidated recent gains. The chart shows the Average True Range (ATR) boundaries and it's clear the index has been well above the recent average range. The chart shows that when this is sustained for more than a few days the index retreats to within the upper range limit. Consequently, we are not likely to see big upward moves in the coming days. Nevertheless, the underlying trend is likely to remain bullish as vaccination rates increase, the stimulus will pass on 'reconciliation', Chairman Powell has promised to keep borrowed money essentially free, and Janet Yellen expects full employment to return in 2022 if the stimulus is passed.  A flattening of the trend does not
mean that strong breakouts will not occur. I expect we will see
more Volatility Squeeze breakouts as volatility decrease
allowing the Bolinger Bands to fall within the Keltner channel
(see SQZ-methodology)
for more explanation.
The continuing strong upward trend
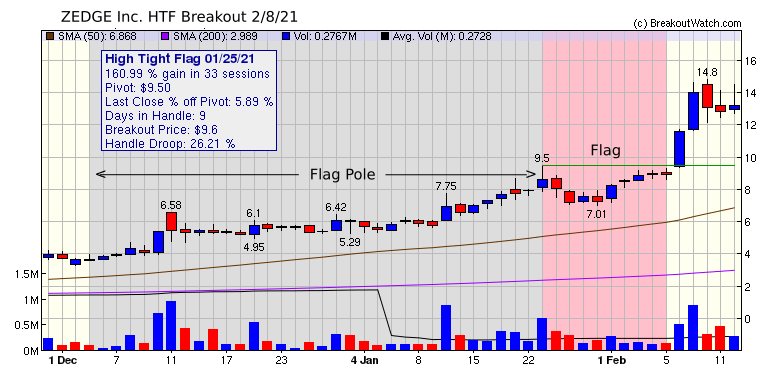
continues to produce rewarding High Tight Flag (HTF) breakouts
with 2of 4 producing greater than 10% gains this week. ZEDGE was
the highest flyer.
 |
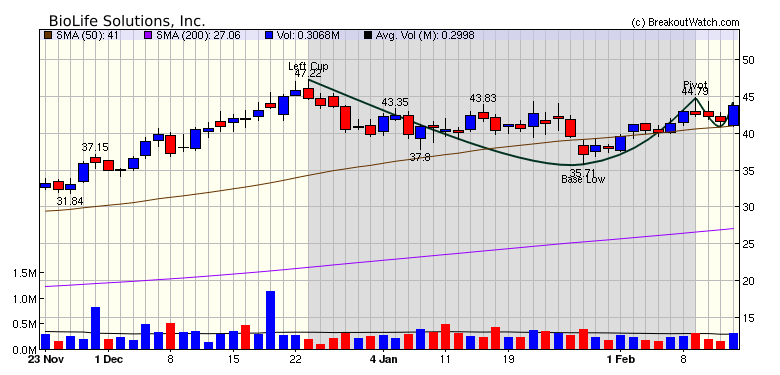
| BioLife
Solutions, Inc 20 years of operating breakoutwatch.com teaches me that although other patterns may occasionally produce better short term gains, the Cup and Handle pattern is the most reliable. BioLife Solutions showed classic handle behavior with some profit taking after setting the pivot, and then strong accumulation on Friday.  |
| No new features this week |
|
New subscribers often
complain that they are overwhelmed with email alerts. These
can be limited by setting filters on the watchlists to limit
alerts to only those with the characteristics you prefer.
Setting a 'Personal Watchlist' can limit the number of alerts
further.
Also, always look at the daily
report and check the section "CwH Stocks Likely to Close above
BoP at Next Session". Use the chart
and stock evaluation to make the best use of the
information.
|
| List | Breakouts | Avg. Gain |
|---|---|---|
| CWH | 11 | 1.6 |
| SQZ | 21 | 4.75 |
| HTF | 4 | 13.04 |
| HSB | 0 | |
| DB | 2 | 5.44 |
| Brkout Date | Symbol | Base | Squeeze | Brkout Price | Brkout Day Close | RS Rank* | Last Close | Current % off BOP | Gain at Intraday High |
|---|---|---|---|---|---|---|---|---|---|
| 2021-02-08 | ZDGE | HTF | n | 9.50 | 11.6 | 98 | 13.22 | 39.16% | 55.75% |
| 2021-02-10 | PLXP | SQZ | y | 6.90 | 8.75 | 84 | 9.52 | 37.97% | 44.93% |
| 2021-02-09 | MESA | SQZ | y | 7.43 | 7.44 | 84 | 9.94 | 33.78% | 45.09% |
| 2021-02-09 | ACMR | CWH | y | 107.29 | 108.2 | 80 | 135.23 | 26.04% | 30.77% |
| 2021-02-08 | INSE | SQZ | y | 6.62 | 7.38 | 83 | 7.84 | 18.43% | 29.88% |
| 2021-02-08 | GPRK | DB | y | 13.63 | 13.82 | 74 | 15.3 | 12.25% | 13.65% |
| 2021-02-08 | AR | HTF | n | 8.03 | 8.08 | 93 | 9 | 12.08% | 12.2% |
| 2021-02-12 | ZVO | SQZ | y | 6.01 | 6.58 | 89 | 6.58 | 9.48% | 21.46% |
| 2021-02-08 | MXC | SQZ | y | 8.61 | 9 | 88 | 9.37 | 8.83% | 65.51% |
| 2021-02-09 | NLS | CWH | n | 27.55 | 30.54 | 96 | 29.16 | 5.84% | 13.9% |
| 2021-02-08 | BLFS | SQZ | y | 41.36 | 42.94 | 90 | 43.74 | 5.75% | 8.29% |
| 2021-02-12 | MYO | HTF | n | 13.89 | 14.58 | 92 | 14.58 | 4.97% | 6.26% |
| 2021-02-08 | RHP | SQZ | y | 70.39 | 71.77 | 82 | 73.5 | 4.42% | 4.53% |
| 2021-02-12 | DMRC | SQZ | y | 42.77 | 44.36 | 83 | 44.36 | 3.72% | 4.47% |
| 2021-02-12 | TNP | SQZ | y | 9.20 | 9.53 | 86 | 9.53 | 3.59% | 4.57% |
| 2021-02-08 | OCN | SQZ | y | 27.15 | 28.5 | 99 | 27.98 | 3.06% | 10.24% |
| 2021-02-10 | EDUC | SQZ | y | 15.81 | 16.34 | 81 | 16.24 | 2.72% | 5.12% |
| 2021-02-09 | AI | SQZ | y | 150.81 | 168.92 | 99 | 153.73 | 1.94% | 17.33% |
| 2021-02-12 | NVTA | SQZ | y | 51.10 | 51.86 | 82 | 51.86 | 1.49% | 2.41% |
| 2021-02-08 | MN | SQZ | y | 6.52 | 6.6 | 89 | 6.6 | 1.23% | 8.08% |
| 2021-02-10 | VER | CWH | y | 37.47 | 37.51 | 98 | 37.8 | 0.88% | 2.1% |
| 2021-02-12 | LWAY | CWH | n | 6.86 | 6.9 | 86 | 6.9 | 0.58% | 1.52% |
| 2021-02-11 | HCAP | CWH | n | 8.00 | 8.11 | 87 | 8.02 | 0.25% | 1.37% |
| 2021-02-12 | DOCU | CWH | n | 263.00 | 263.3 | 82 | 263.3 | 0.11% | 0.19% |
| 2021-02-12 | STMP | CWH | n | 276.69 | 276.73 | 80 | 276.73 | 0.01% | 1.25% |
| 2021-02-08 | NET | DB | y | 87.15 | 91.13 | 94 | 85.95 | -1.38% | 9.89% |
| 2021-02-09 | MGI | CWH | n | 9.30 | 9.69 | 94 | 9.15 | -1.61% | 9.89% |
| 2021-02-09 | SGC | CWH | y | 26.48 | 26.83 | 82 | 25.96 | -1.96% | 3.35% |
| 2021-02-09 | BNSO | SQZ | y | 6.65 | 7 | 89 | 6.46 | -2.86% | 15.04% |
| 2021-02-08 | NSYS | SQZ | y | 8.28 | 8.7 | 86 | 8.03 | -3.02% | 8.7% |
| 2021-02-10 | SGC | SQZ | y | 26.84 | 26.86 | 84 | 25.96 | -3.28% | 1.64% |
| 2021-02-09 | EYEN | CWH | n | 7.25 | 7.36 | 83 | 6.98 | -3.72% | 6.48% |
| 2021-02-11 | BW | HTF | n | 7.64 | 7.75 | 95 | 7.33 | -4.06% | 7.85% |
| 2021-02-08 | MCRB | SQZ | y | 27.05 | 28.92 | 97 | 25.94 | -4.1% | 10.5% |
| 2021-02-08 | IGMS | SQZ | y | 107.48 | 119.51 | 90 | 102.95 | -4.21% | 18.26% |
| 2021-02-10 | BNSO | SQZ | y | 7.01 | 7.25 | 90 | 6.46 | -7.85% | 9.13% |
| 2021-02-08 | IDYA | CWH | n | 20.75 | 20.95 | 86 | 18.91 | -8.87% | 3.04% |
| 2021-02-08 | COTY | SQZ | y | 7.65 | 7.94 | 81 | 6.78 | -11.37% | 7.19% |
| *RS Rank on day before breakout. | |||||||||
| Symbol | BO Price |
BO Vol. |
Company | Industry | RS Rank |
Last Close |
|---|---|---|---|---|---|---|
| LEAF | 7.62 | 717,598 | Leaf Group Ltd. | Internet Content & Information | 86 | 7.33 |
| CYH | 11.45 | 3,071,384 | Community Health Systems - Inc. | Medical Care Facilities | 83 | 9.25 |
| DLTH | 15.29 | 510,878 | Duluth Holdings Inc. | Apparel Retail | 81 | 13.91 |
| These stocks meet our suggested screening factors
for our Cup and Handle Chart Pattern watchlist. See Revised Rules for Trading Cup and Handle Breakouts |
||||||
| Index | Value | Change Week | Change YTD | Trend1 |
|---|---|---|---|---|
| Dow | 31458.4 |
1% | 2.78% | Up |
| NASDAQ | 14095.5 |
1.73% | 9.37% | Up |
| S&P 500 | 3934.83 |
1.23% | 4.76% | Up |
|
1The Market Trend is derived from
our proprietary market model. The market model is described on
the site here.
2The site also shows industry rankings based on fundamentals, combined technical and fundamentals, and on price alone. The site also shows daily industry movements. |
||||
| 1 Week | 13 Weeks | 26 Weeks | Year-to-Date |
|---|---|---|---|
| NASDAQ Composite |
NASDAQ Composite 19.16 |
NASDAQ Composite 27.92 |
NASDAQ Composite 9.37 |
| 1 Week | 3 Weeks | 13 Weeks | 26 Weeks |
|---|---|---|---|
| Luxury Goods |
Uranium |
Silver |
| Solar 132 |
Thermal Coal 67 |
Department Stores 133 |
Department Stores 139 |
| Charts of each industry rank and performance over 12 months are available on the site | |||
If you received this newsletter from a friend and you would like to receive it regularly please go to the BreakoutWatch.com site and you will then be able to register to receive the newsletter.
Copyright (c) 02/13/2021 NBIcharts, LLC dba BreakoutWatch.com. All
rights reserved.
" BreakoutWatch," the BreakoutWatch.com "eye" logo, and the slogan
"tomorrow's breakouts today" are service marks of NBIcharts LLC. All
other marks are the property of their respective owners, and are used
for descriptive purposes only.
BreakoutWatch is not affiliated with Investor's Business Daily or with Mr. William O'Neil. Our site, research and analysis is supported entirely by subscription and is free from advertising.