Breakoutwatch Weekly Summary 02/20/21
You are receiving this email because you are or were a
BreakoutWatch.com subscriber, or have subscribed to our weekly
newsletter. This newsletter summarizes the breakout events of the week
and provides additional guidance that does not fit into our daily
format. It is published each weekend.
Newsletter Archive: https://www.breakoutwatch.com/content/newsletters
|
Number of Breakouts Falls as
Consolidation Continues
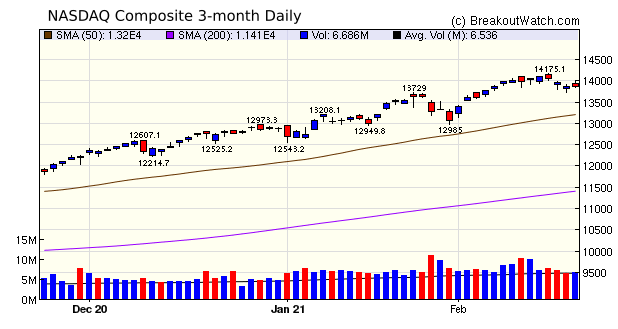
The NASDAQ slipped 1.6% this week
as Treasury yields rose. The large cap tech stocks have been
supported by cheap money and the prospect of rising interest
rates caused some selling. The technology sector dropped 1.9%.
The index did pick up slightly on Friday after Treasury
Secretary Yellen reaffirmed that a big stimulus was needed, and
vaccination supplies were expected to double soon.
The stimulus, expected to be about
1.5 Trillion, combined with lowering Covid rates, will
lead to higher employment and a significantly stronger economy.
This will lead to some rotation out of the high priced tech
stocks into Financial assets and more value oriented
stocks.
 There were just two cup and handle
pattern breakouts this week but they did deliver a satisfying
9.4% average gain. The Volatility Squeeze watchlist was the only
other pattern to deliver breakouts with a total of eight
averaging 3%.
|
|
Ultragenyx Pharmaceutical Inc. (RARE) Ultragenix appears to have begun building the right of a handle after substantial profit taking after setting the pivot at 175 six days ago. Volume was well above average on Friday although it just failed to clear resistance at the 50 day moving average level. RARE is unlikely to break out in the immediate future, but taking a position here could be profitable with a possible 18% upside to the pivot point. See Ultragenyx: Multiple Potential Catalysts Ahead 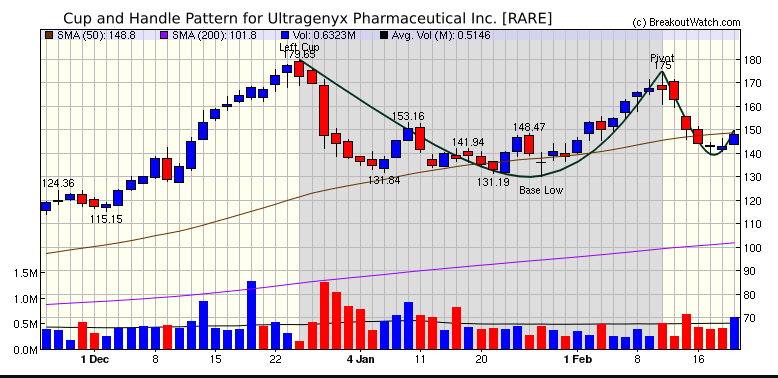 |
| No new features this week |
|
Our latest strategy
suggestions are here.
|
| List | Breakouts | Avg. Gain |
|---|---|---|
| CWH | 2 | 9.36 |
| SQZ | 8 | 3.03 |
| HTF | 0 | |
| HSB | 0 | |
| DB | 0 |
| Brkout Date | Symbol | Base | Squeeze | Brkout Price | Brkout Day Close | RS Rank* | Last Close | Current % off BOP | Gain at Intraday High |
|---|---|---|---|---|---|---|---|---|---|
| 2021-02-16 | KZIA | SQZ | y | 10.17 | 10.36 | 89 | 11.7 | 15.04% | 20.65% |
| 2021-02-18 | FPRX | CWH | n | 21.43 | 21.44 | 95 | 23.82 | 11.15% | 11.39% |
| 2021-02-17 | ATLC | CWH | n | 30.10 | 30.56 | 90 | 32.38 | 7.57% | 7.97% |
| 2021-02-17 | MACK | SQZ | y | 7.80 | 8.27 | 88 | 8.18 | 4.87% | 19.87% |
| 2021-02-19 | CHWY | SQZ | y | 110.30 | 113.95 | 91 | 113.95 | 3.31% | 5.49% |
| 2021-02-16 | WYY | SQZ | y | 12.76 | 13.56 | 99 | 13.18 | 3.29% | 12.07% |
| 2021-02-16 | TRIL | SQZ | y | 13.24 | 13.45 | 82 | 13.42 | 1.36% | 3.66% |
| 2021-02-16 | MXC | SQZ | y | 9.38 | 10.34 | 91 | 9.43 | 0.53% | 16.2% |
| 2021-02-16 | MTSC | SQZ | y | 58.69 | 58.73 | 89 | 58.66 | -0.05% | 0.19% |
| 2021-02-18 | NETE | SQZ | y | 15.37 | 17.11 | 90 | 14.74 | -4.1% | 16.27% |
| *RS Rank on day before breakout. | |||||||||
| Symbol | BO Price |
BO Vol. |
Company | Industry | RS Rank |
Last Close |
|---|---|---|---|---|---|---|
| RMED | 9.21 | 591,128 | Ra Medical Systems - Inc. | Medical Devices | 99 | 8.62 |
| ZVO | 7.30 | 510,738 | Zovio Inc. | Education & Training Services | 86 | 6.05 |
| CYH | 11.45 | 3,084,344 | Community Health Systems - Inc. | Medical Care Facilities | 80 | 8.91 |
| These stocks meet our suggested screening factors
for our Cup and Handle Chart Pattern watchlist. See Revised Rules for Trading Cup and Handle Breakouts |
||||||
| Index | Value | Change Week | Change YTD | Trend1 |
|---|---|---|---|---|
| Dow | 31494.3 |
0.11% | 2.9% | Up |
| NASDAQ | 13874.5 |
-1.57% | 7.65% | Up |
| S&P 500 | 3906.71 |
-0.71% | 4.01% | Up |
|
1The Market Trend is derived from
our proprietary market model. The market model is described on
the site here.
2The site also shows industry rankings based on fundamentals, combined technical and fundamentals, and on price alone. The site also shows daily industry movements. |
||||
| 1 Week | 13 Weeks | 26 Weeks | Year-to-Date |
|---|---|---|---|
| Dow Jones |
NASDAQ Composite 17.04 |
NASDAQ Composite 22.66 |
NASDAQ Composite 7.65 |
| 1 Week | 3 Weeks | 13 Weeks | 26 Weeks |
|---|---|---|---|
| Uranium |
Uranium |
Silver |
| Oil & Gas E&P 35 |
Oil & Gas Drilling 55 |
Department Stores 128 |
Textile Manufacturing 133 |
| Charts of each industry rank and performance over 12 months are available on the site | |||
If you received this newsletter from a friend and you would like to receive it regularly please go to the BreakoutWatch.com site and you will then be able to register to receive the newsletter.
Copyright (c) 02/20/2021 NBIcharts, LLC dba BreakoutWatch.com. All
rights reserved.
" BreakoutWatch," the BreakoutWatch.com "eye" logo, and the slogan
"tomorrow's breakouts today" are service marks of NBIcharts LLC. All
other marks are the property of their respective owners, and are used
for descriptive purposes only.
BreakoutWatch is not affiliated with Investor's Business Daily or with Mr. William O'Neil. Our site, research and analysis is supported entirely by subscription and is free from advertising.