Breakoutwatch Weekly Summary 03/06/21
You are receiving this email because you are or were a
BreakoutWatch.com subscriber, or have subscribed to our weekly
newsletter. This newsletter summarizes the breakout events of the week
and provides additional guidance that does not fit into our daily
format. It is published each weekend.
Newsletter Archive: https://www.breakoutwatch.com/content/newsletters
| Trend Models Turn Negative but
Quick Return to Positive Likely. New Intraday Chart Feature In a volatile trading week, marked by rising long term rates and mid-week uncertainty about the passage of the Covid stimulus package, our market trend signals turned negative on Wednesday. By Friday, passage of the bill looked more certain and there was also good employment news, which almost doubled estimates. The major indexes all finished strongly on Friday and I expect the trends will turn positive again when the stimulus bill passes. Just how much upward movement can be expected is doubtful, as the stimulus is probably already largely priced into the market. In confirmation of the rotation out of the big tech stocks into smaller cap cyclicals, the Russell 2000 is up 11% for the year to date, while the NASDAQ is up just 0.3%. 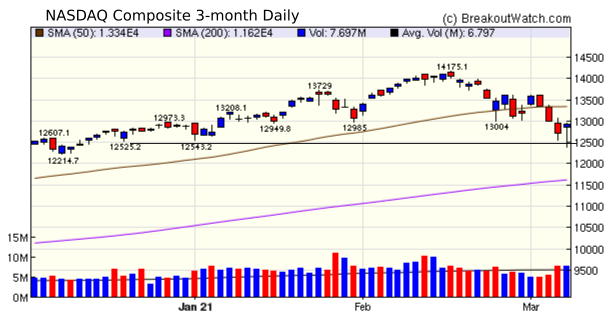 The number of breakouts did rise
from last weeks 11 to 24 but gains were meager. It is suggested
to wait for the trends to turn positive before putting money at
risk.
|
|
Hancock Whitney Corporation [HWC] HWC is our top rated stock to possibly breakout on Monday. 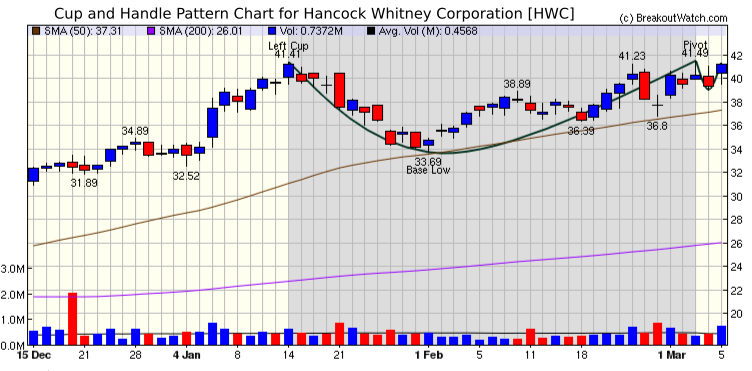 |
| Intraday Chart for Most Symbols It has always been possible to get an intraday chart for any stock on our watchlists from our Technical Analysis chart. You can now get an intraday chart for most symbols from the same link, although there is a short delay while the data is gathered. From the intraday chart you can also get our stock evaluation. 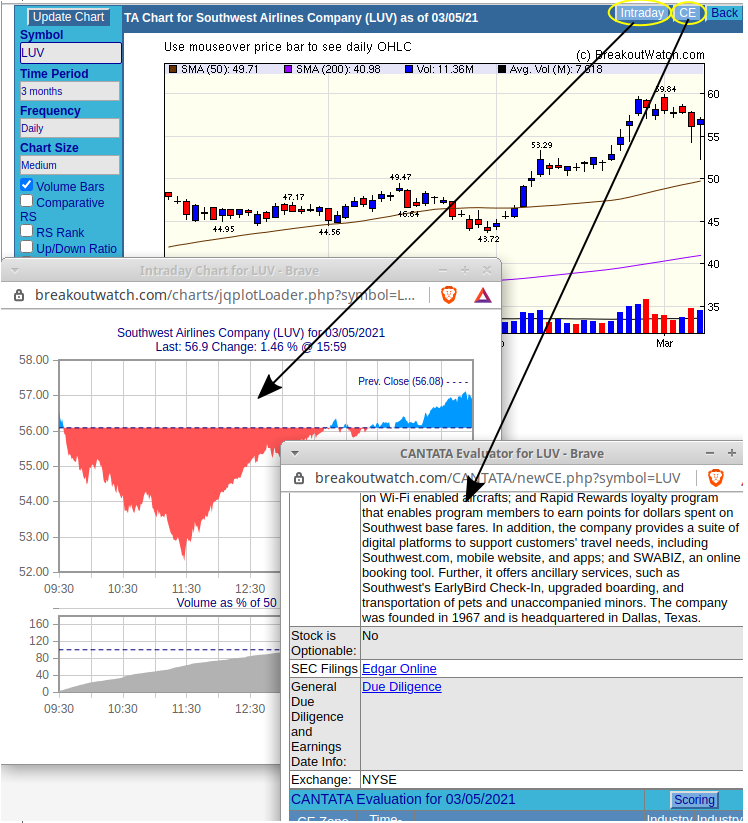 |
|
Our latest strategy
suggestions are here.
|
| List | Breakouts | Avg. Gain |
|---|---|---|
| CWH | 8 | 0.15 |
| SQZ | 14 | 2.36 |
| HTF | 2 | -6.27 |
| HSB | 0 | |
| DB | 0 |
| Brkout Date | Symbol | Base | Squeeze | Brkout Price | Brkout Day Close | RS Rank* | Last Close | Current % off BOP | Gain at Intraday High |
|---|---|---|---|---|---|---|---|---|---|
| 2021-03-02 | MIK | SQZ | y | 16.86 | 18.02 | 94 | 21.78 | 29.18% | 32.27% |
| 2021-03-02 | MG | SQZ | y | 8.63 | 8.72 | 80 | 9.72 | 12.63% | 13.57% |
| 2021-03-02 | KTB | CWH | n | 45.10 | 47 | 80 | 50.7 | 12.42% | 13.3% |
| 2021-03-01 | FTSI | SQZ | y | 19.16 | 20.28 | 92 | 21.4 | 11.69% | 14.46% |
| 2021-03-05 | CNR | SQZ | y | 11.95 | 12.81 | 83 | 12.81 | 7.2% | 7.28% |
| 2021-03-02 | FTSI | SQZ | y | 20.29 | 20.67 | 91 | 21.4 | 5.47% | 8.08% |
| 2021-03-01 | LDL | CWH | n | 36.51 | 39.39 | 90 | 37.73 | 3.34% | 15.2% |
| 2021-03-05 | GPS | CWH | n | 26.61 | 27.31 | 84 | 27.31 | 2.63% | 6.69% |
| 2021-03-03 | GIII | SQZ | y | 30.18 | 30.75 | 87 | 30.9 | 2.39% | 5.04% |
| 2021-03-01 | W | SQZ | y | 288.99 | 335.65 | 86 | 295.66 | 2.31% | 18.69% |
| 2021-03-03 | SCHN | CWH | n | 38.25 | 38.31 | 88 | 38.99 | 1.93% | 2.61% |
| 2021-03-03 | USX | CWH | n | 10.24 | 10.31 | 81 | 10.25 | 0.1% | 4.49% |
| 2021-03-02 | TX | CWH | n | 33.55 | 34.42 | 80 | 33.46 | -0.27% | 12.76% |
| 2021-03-02 | X | SQZ | y | 18.31 | 18.57 | 86 | 18.15 | -0.87% | 7.09% |
| 2021-03-02 | MT | CWH | n | 25.05 | 25.14 | 82 | 24.56 | -1.96% | 0.96% |
| 2021-03-02 | DCP | SQZ | y | 23.93 | 24.07 | 86 | 23.43 | -2.09% | 5.27% |
| 2021-03-03 | X | SQZ | y | 18.58 | 18.75 | 87 | 18.15 | -2.31% | 5.53% |
| 2021-03-01 | CRIS | SQZ | y | 9.85 | 10.43 | 99 | 9.47 | -3.86% | 6.9% |
| 2021-03-03 | BSET | SQZ | y | 22.19 | 22.38 | 91 | 21.29 | -4.06% | 2.93% |
| 2021-03-02 | NMM | HTF | n | 18.94 | 19.5 | 94 | 17.89 | -5.54% | 7.18% |
| 2021-03-02 | NMCI | HTF | n | 7.43 | 7.49 | 97 | 6.91 | -7% | 5.56% |
| 2021-03-02 | ALDX | SQZ | y | 12.21 | 12.43 | 92 | 11.18 | -8.44% | 3.19% |
| 2021-03-02 | CVNA | SQZ | y | 311.93 | 314.84 | 91 | 261.54 | -16.15% | 3.67% |
| 2021-03-01 | FIVN | CWH | y | 194.04 | 197.79 | 84 | 161.1 | -16.98% | 3.97% |
| *RS Rank on day before breakout. | |||||||||
| Symbol | BO Price |
BO Vol. |
Company | Industry | RS Rank |
Last Close |
|---|---|---|---|---|---|---|
| ESI | 19.02 | 2,661,310 | Element Solutions Inc. | Specialty Chemicals | 81 | 18.49 |
| MRNS | 16.85 | 517,668 | Marinus Pharmaceuticals - Inc. | Biotechnology | 80 | 16.54 |
| These stocks meet our suggested screening factors
for our Cup and Handle Chart Pattern watchlist. See Revised Rules for Trading Cup and Handle Breakouts |
||||||
| Index | Value | Change Week | Change YTD | Trend1 |
|---|---|---|---|---|
| Dow | 31496.3 |
1.82% | 2.91% | Down |
| NASDAQ | 12920.2 |
-2.06% | 0.25% | Down |
| S&P 500 | 3841.94 |
0.81% | 2.29% | Down |
|
1The Market Trend is derived from
our proprietary market model. The market model is described on
the site here.
2The site also shows industry rankings based on fundamentals, combined technical and fundamentals, and on price alone. The site also shows daily industry movements. |
||||
| 1 Week | 13 Weeks | 26 Weeks | Year-to-Date |
|---|---|---|---|
| Dow Jones |
Dow Jones 3.66 |
NASDAQ Composite 14.21 |
Dow Jones 2.91 |
| 1 Week | 3 Weeks | 13 Weeks | 26 Weeks |
|---|---|---|---|
| Uranium |
Luxury Goods |
Silver |
| REIT - Hotel & Motel 39 |
Airlines 80 |
Oil & Gas Drilling 128 |
Department Stores 135 |
| Charts of each industry rank and performance over 12 months are available on the site | |||
If you received this newsletter from a friend and you would like to receive it regularly please go to the BreakoutWatch.com site and you will then be able to register to receive the newsletter.
Copyright (c) 03/06/2021 NBIcharts, LLC dba BreakoutWatch.com. All
rights reserved.
" BreakoutWatch," the BreakoutWatch.com "eye" logo, and the slogan
"tomorrow's breakouts today" are service marks of NBIcharts LLC. All
other marks are the property of their respective owners, and are used
for descriptive purposes only.
BreakoutWatch is not affiliated with Investor's Business Daily or with Mr. William O'Neil. Our site, research and analysis is supported entirely by subscription and is free from advertising.