Breakoutwatch Weekly Summary 03/20/21
You are receiving this email because you are or were a
BreakoutWatch.com subscriber, or have subscribed to our weekly
newsletter. This newsletter summarizes the breakout events of the week
and provides additional guidance that does not fit into our daily
format. It is published each weekend.
Newsletter Archive: https://www.breakoutwatch.com/content/newsletters
| NASDAQ Trend Continues Down;
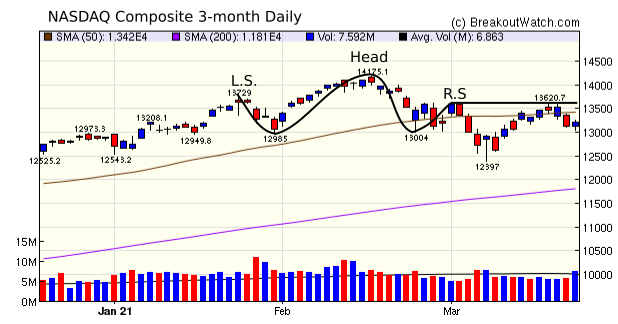
Markets Concerned over 10-year Treasury Yield The three major indexes all closed down but our trend indicators for the Dow and S&P 500 remain positive. Traders continue to fret over the 10-year yield which rose to 1.76% driven by inflation fears, but closed on Friday at 1.73%. The inflation fears are driven by the COVID stimulus which is expected to dramatically spur economic growth, and inflation along with it, but the Fed maintains it will keep the Fed Funds rate low until there is substantial improvement in employment. Raising the Fed Funds rate would normally be one tool the Fed has to fight inflation, but that appears to be off the table for now. Meanwhile, the NASDAQ Chart shows that a head and shoulders pattern formed at the beginning of March, but earlier this week the index failed to penetrate resistance at the level of the left shoulder (L.S.) and has since retreated further. Head and Shoulders patterns are considered bearish.  Gains from breakouts this week were
more subdued than recently. The best performer was SOLY which
broke out from a High Tight Flag pattern and closed for a gain
of 12.9%.
|
| New Forest
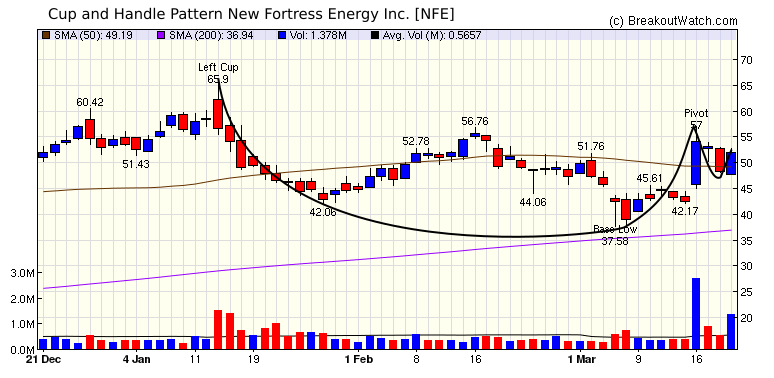
Energy (NFE) NFE is the top rated stock on our daily list of stocks likely to exceed their breakout price at the next session. Note the volume spike when the stock set its pivot, which was followed by the usual profit taking, and then volume surged again on Friday.  |
| No new features this week |
|
Our latest strategy
suggestions are here.
|
| List | Breakouts | Avg. Gain |
|---|---|---|
| CWH | 4 | 1.27 |
| SQZ | 22 | 1.62 |
| HTF | 1 | 12.93 |
| HSB | 0 | |
| DB | 0 |
| Brkout Date | Symbol | Base | Squeeze | Brkout Price | Brkout Day Close | RS Rank* | Last Close | Current % off BOP | Gain at Intraday High |
|---|---|---|---|---|---|---|---|---|---|
| 2021-03-15 | SOLY | HTF | y | 15.39 | 16.71 | 73 | 17.38 | 12.93% | 21.05% |
| 2021-03-19 | CRIS | SQZ | y | 11.11 | 12.14 | 99 | 12.14 | 9.27% | 11.34% |
| 2021-03-16 | AFMD | CWH | n | 7.73 | 8.34 | 89 | 8.32 | 7.63% | 11% |
| 2021-03-15 | DDS | SQZ | y | 91.69 | 93.96 | 91 | 97.92 | 6.79% | 9.35% |
| 2021-03-17 | STRO | SQZ | y | 23.66 | 23.96 | 87 | 24.96 | 5.49% | 9.34% |
| 2021-03-17 | TSQ | SQZ | y | 10.48 | 11.75 | 84 | 11.02 | 5.15% | 15.27% |
| 2021-03-19 | LEU | SQZ | y | 26.50 | 27.76 | 92 | 27.76 | 4.75% | 8.6% |
| 2021-03-15 | BBBY | SQZ | y | 30.17 | 32.6 | 94 | 31.58 | 4.67% | 10.47% |
| 2021-03-15 | TNP | SQZ | y | 10.23 | 10.44 | 90 | 10.59 | 3.52% | 6.06% |
| 2021-03-15 | SLS | SQZ | y | 10.27 | 11.05 | 96 | 10.62 | 3.41% | 18.6% |
| 2021-03-18 | IKNX | SQZ | y | 10.36 | 10.71 | 90 | 10.7 | 3.28% | 8.3% |
| 2021-03-17 | YETI | SQZ | y | 72.91 | 75.24 | 82 | 75.03 | 2.91% | 3.96% |
| 2021-03-17 | KOP | SQZ | y | 36.23 | 36.82 | 84 | 37.26 | 2.84% | 8.06% |
| 2021-03-15 | JWN | SQZ | y | 41.38 | 45.79 | 85 | 42.49 | 2.68% | 11.09% |
| 2021-03-17 | FLXS | CWH | n | 38.13 | 38.29 | 87 | 39.09 | 2.52% | 7.53% |
| 2021-03-17 | LCUT | CWH | n | 15.49 | 15.54 | 80 | 15.84 | 2.26% | 4.71% |
| 2021-03-17 | PBI | SQZ | y | 9.42 | 9.44 | 91 | 9.6 | 1.91% | 3.61% |
| 2021-03-19 | SIBN | SQZ | y | 33.36 | 33.83 | 83 | 33.83 | 1.41% | 2.34% |
| 2021-03-19 | GWPH | SQZ | y | 215.16 | 215.25 | 85 | 215.25 | 0.04% | 0.13% |
| 2021-03-17 | AIRT | SQZ | y | 26.76 | 27.2 | 90 | 26.62 | -0.52% | 1.68% |
| 2021-03-17 | QRTEA | SQZ | y | 12.68 | 13.06 | 89 | 12.51 | -1.34% | 5.4% |
| 2021-03-17 | NCR | SQZ | y | 37.60 | 39.08 | 80 | 36.92 | -1.81% | 4.26% |
| 2021-03-17 | SID | SQZ | y | 6.56 | 6.71 | 92 | 6.42 | -2.13% | 6.48% |
| 2021-03-17 | ALTM | SQZ | y | 55.34 | 56.26 | 92 | 53.25 | -3.78% | 4.81% |
| 2021-03-17 | PLT | SQZ | y | 44.10 | 44.55 | 96 | 41.93 | -4.92% | 1.5% |
| 2021-03-17 | DLTH | CWH | n | 16.24 | 16.77 | 82 | 15.05 | -7.33% | 3.82% |
| 2021-03-17 | NEXA | SQZ | y | 10.99 | 11 | 80 | 10.12 | -7.92% | 2.55% |
| *RS Rank on day before breakout. | |||||||||
| Symbol | BO Price |
BO Vol. |
Company | Industry | RS Rank |
Last Close |
|---|---|---|---|---|---|---|
| DSKE | 7.49 | 628,048 | Daseke - Inc. | Trucking | 92 | 7.42 |
| TFFP | 18.48 | 580,299 | TFF Pharmaceuticals - Inc. | Biotechnology | 85 | 15.83 |
| ENBL | 7.42 | 2,378,216 | Enable Midstream Partners - LP | Oil & Gas Midstream | 80 | 6.75 |
| These stocks meet our suggested screening factors
for our Cup and Handle Chart Pattern watchlist. See Revised Rules for Trading Cup and Handle Breakouts |
||||||
| Index | Value | Change Week | Change YTD | Trend1 |
|---|---|---|---|---|
| Dow | 32628 |
-0.46% | 6.6% | Up |
| NASDAQ | 13215.2 |
-0.79% | 2.54% | Down |
| S&P 500 | 3913.1 |
-0.77% | 4.18% | Up |
|
1The Market Trend is derived from
our proprietary market model. The market model is described on
the site here.
2The site also shows industry rankings based on fundamentals, combined technical and fundamentals, and on price alone. The site also shows daily industry movements. |
||||
| 1 Week | 13 Weeks | 26 Weeks | Year-to-Date |
|---|---|---|---|
| Dow Jones |
Dow Jones 3.6 |
NASDAQ Composite 22.44 |
Dow Jones 6.6 |
| 1 Week | 3 Weeks | 13 Weeks | 26 Weeks |
|---|---|---|---|
| Luxury Goods |
Uranium |
Solar |
| Advertising Agencies 55 |
Recreational Vehicles 64 |
Oil & Gas Drilling 121 |
Oil & Gas Drilling 139 |
| Charts of each industry rank and performance over 12 months are available on the site | |||
If you received this newsletter from a friend and you would like to receive it regularly please go to the BreakoutWatch.com site and you will then be able to register to receive the newsletter.
Copyright (c) 03/20/2021 NBIcharts, LLC dba BreakoutWatch.com. All
rights reserved.
" BreakoutWatch," the BreakoutWatch.com "eye" logo, and the slogan
"tomorrow's breakouts today" are service marks of NBIcharts LLC. All
other marks are the property of their respective owners, and are used
for descriptive purposes only.
BreakoutWatch is not affiliated with Investor's Business Daily or with Mr. William O'Neil. Our site, research and analysis is supported entirely by subscription and is free from advertising.