Breakoutwatch Weekly Summary 04/10/21
You are receiving this email because you are or were a
BreakoutWatch.com subscriber, or have subscribed to our weekly
newsletter. This newsletter summarizes the breakout events of the week
and provides additional guidance that does not fit into our daily
format. It is published each weekend.
Newsletter Archive: https://www.breakoutwatch.com/content/newsletters
| 65 Breakouts Last Week as NASDAQ
Outperforms the DJI and S&P 500 The NASDAQ gained 3.1% this week outperforming the DJI (2.0) and S&P 500(2.7%). For the year, however, the DJI is leading with a gain of 10.4% while the NASDAQ, suffering from a fear that the mega caps are over extended, has gained just 7.9%. Both the DJI and S&P 500 set new highs during the week while the NASDAQ could soon face resistance as it approaches February's high. The week began strongly following the jobs report released while markets were closed on Good Friday. Other factors contributing to the bullish mood were a lowering in inflation fears as the 10 year yield fell 4 points; an increase in the ISM index indicating the economy is strengthening. 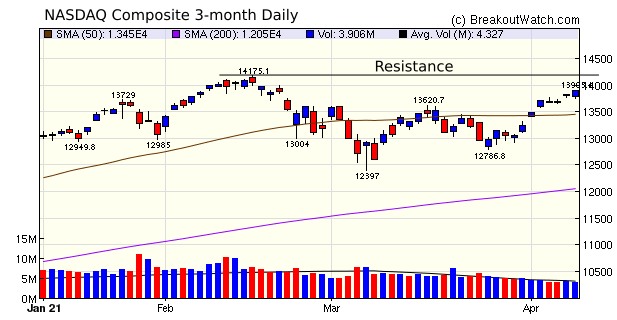 |
| Freshpet Inc.
(FRPT) Freshpet is on our list of stocks likely to breakout on Monday (this list is published daily in our daily Report sent to subscribers). The handle shows the typical behavior of a stock ready to move above the pivot. There was profit taking after those who had held on during the cup low recouped some losses and then the stock moved up over the last 2 days. 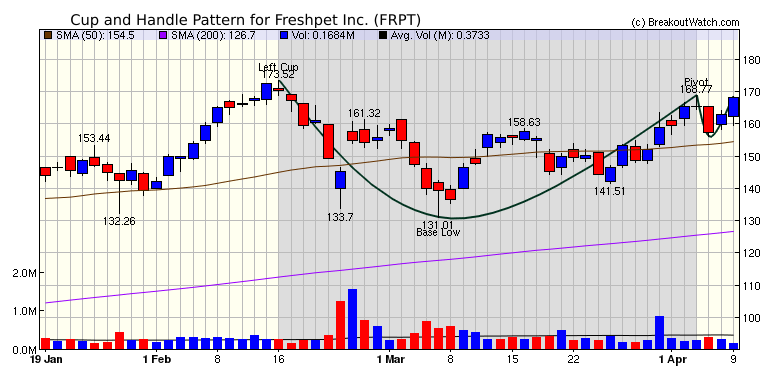 |
| No new features this week |
|
Our latest strategy
suggestions are here.
|
| List | Breakouts | Avg. Gain |
|---|---|---|
| CWH | 6 | 1.77 |
| SQZ | 55 | 3.22 |
| HTF | 1 | 2.59 |
| HSB | 0 | |
| DB | 4 | 5.41 |
| Brkout Date | Symbol | Base | Squeeze | Brkout Price | Brkout Day Close | RS Rank* | Last Close | Current % off BOP | Gain at Intraday High |
|---|---|---|---|---|---|---|---|---|---|
| 2021-04-06 | NTZ | SQZ | y | 12.51 | 15 | 99 | 16.4 | 31.1% | 35.89% |
| 2021-04-05 | HYRE | SQZ | y | 10.11 | 10.31 | 97 | 12.16 | 20.28% | 22.65% |
| 2021-04-07 | HYRE | SQZ | y | 10.75 | 57.38 | 98 | 12.16 | 13.12% | 15.35% |
| 2021-04-05 | BXC | SQZ | y | 40.43 | 42.41 | 97 | 45.66 | 12.94% | 13.68% |
| 2021-04-05 | BOOT | SQZ | y | 61.81 | 62.92 | 94 | 68.74 | 11.21% | 12.25% |
| 2021-04-05 | JMP | SQZ | y | 6.09 | 6.4 | 88 | 6.72 | 10.34% | 10.34% |
| 2021-04-05 | BSIG | SQZ | y | 20.80 | 20.86 | 82 | 22.93 | 10.24% | 12.5% |
| 2021-04-07 | BNSO | CWH | n | 7.59 | 9.89 | 87 | 8.27 | 8.96% | 67.32% |
| 2021-04-07 | WLL | SQZ | y | 32.98 | 57.38 | 99 | 35.66 | 8.13% | 10.52% |
| 2021-04-07 | LIVE | SQZ | y | 25.91 | 57.38 | 93 | 28 | 8.07% | 11.35% |
| 2021-04-07 | RELL | SQZ | y | 7.00 | 57.38 | 81 | 7.56 | 8% | 14.29% |
| 2021-04-08 | BSIG | CWH | n | 21.28 | 22.55 | 83 | 22.93 | 7.75% | 9.96% |
| 2021-04-06 | BXC | SQZ | y | 42.42 | 43.13 | 98 | 45.66 | 7.64% | 8.35% |
| 2021-04-05 | QTRX | SQZ | y | 61.46 | 62.88 | 87 | 66.12 | 7.58% | 11.98% |
| 2021-04-09 | CSSE | DB | n | 30.50 | 32.57 | 94 | 32.57 | 6.79% | 6.79% |
| 2021-04-07 | JAN | SQZ | y | 8.87 | 57.38 | 94 | 9.46 | 6.65% | 8.15% |
| 2021-04-07 | BXC | SQZ | y | 43.14 | 43.29 | 98 | 45.66 | 5.84% | 6.54% |
| 2021-04-09 | HYRE | SQZ | y | 11.52 | 12.16 | 98 | 12.16 | 5.56% | 7.64% |
| 2021-04-07 | UMC | SQZ | y | 8.92 | 57.38 | 91 | 9.4 | 5.38% | 7.62% |
| 2021-04-05 | CELH | DB | n | 50.89 | 51.91 | 98 | 53.54 | 5.21% | 7.45% |
| 2021-04-05 | BRKS | DB | n | 91.10 | 98.36 | 86 | 95.7 | 5.05% | 11.56% |
| 2021-04-09 | WLL | SQZ | y | 33.95 | 35.66 | 99 | 35.66 | 5.04% | 7.36% |
| 2021-04-09 | PRTS | SQZ | y | 15.64 | 16.4 | 96 | 16.4 | 4.86% | 5.75% |
| 2021-04-09 | ASIX | SQZ | y | 27.29 | 28.57 | 87 | 28.57 | 4.69% | 4.87% |
| 2021-04-08 | ALGN | DB | n | 566.65 | 575.75 | 86 | 592.56 | 4.57% | 4.65% |
| 2021-04-09 | BOOT | SQZ | y | 65.78 | 68.74 | 94 | 68.74 | 4.5% | 5.47% |
| 2021-04-05 | ESTA | SQZ | y | 66.11 | 67.45 | 96 | 68.98 | 4.34% | 11.15% |
| 2021-04-06 | PRPL | SQZ | y | 32.65 | 33 | 93 | 34.01 | 4.17% | 4.38% |
| 2021-04-09 | BXC | CWH | n | 43.85 | 45.66 | 97 | 45.66 | 4.13% | 4.81% |
| 2021-04-09 | DDS | SQZ | y | 96.21 | 100.17 | 95 | 100.17 | 4.12% | 4.55% |
| 2021-04-09 | LIVE | SQZ | y | 27.11 | 28 | 95 | 28 | 3.28% | 6.42% |
| 2021-04-05 | LEE | HTF | n | 27.77 | 29.56 | 99 | 28.49 | 2.59% | 12.5% |
| 2021-04-06 | ESTA | SQZ | y | 67.46 | 71.31 | 97 | 68.98 | 2.25% | 8.92% |
| 2021-04-07 | SCU | SQZ | y | 22.01 | 57.38 | 82 | 22.49 | 2.18% | 3.04% |
| 2021-04-05 | DKL | SQZ | y | 36.98 | 37.61 | 89 | 37.73 | 2.03% | 4.65% |
| 2021-04-07 | CRTO | SQZ | y | 35.37 | 35.63 | 95 | 35.94 | 1.61% | 4.24% |
| 2021-04-07 | DKL | SQZ | y | 37.19 | 38.48 | 90 | 37.73 | 1.45% | 3.95% |
| 2021-04-08 | CPLG | SQZ | y | 9.36 | 9.5 | 89 | 9.49 | 1.39% | 2.24% |
| 2021-04-09 | ASX | SQZ | y | 7.98 | 8.08 | 80 | 8.08 | 1.25% | 1.5% |
| 2021-04-09 | ACTG | SQZ | y | 6.48 | 6.56 | 87 | 6.56 | 1.23% | 2.01% |
| 2021-04-07 | PSEC | SQZ | y | 7.91 | 57.38 | 81 | 8 | 1.14% | 1.64% |
| 2021-04-06 | CRC | SQZ | y | 24.01 | 24.12 | 99 | 24.25 | 1% | 2.08% |
| 2021-04-09 | CMA | SQZ | y | 71.00 | 71.49 | 83 | 71.49 | 0.69% | 1.78% |
| 2021-04-07 | TA | SQZ | y | 27.62 | 57.38 | 80 | 27.8 | 0.65% | 1.81% |
| 2021-04-07 | CRC | SQZ | y | 24.13 | 24.14 | 99 | 24.25 | 0.5% | 1.57% |
| 2021-04-09 | CMD | CWH | n | 83.50 | 83.76 | 81 | 83.76 | 0.31% | 0.56% |
| 2021-04-05 | RGS | SQZ | y | 12.83 | 13.15 | 82 | 12.87 | 0.31% | 6.24% |
| 2021-04-06 | GWPH | SQZ | y | 217.60 | 217.65 | 89 | 217.93 | 0.15% | 0.18% |
| 2021-04-09 | SCU | SQZ | y | 22.46 | 22.49 | 80 | 22.49 | 0.13% | 0.98% |
| 2021-04-09 | PTVCB | SQZ | y | 23.02 | 23.05 | 81 | 23.05 | 0.13% | 0.13% |
| 2021-04-09 | NEXA | SQZ | y | 10.47 | 10.48 | 86 | 10.48 | 0.1% | 1.62% |
| 2021-04-07 | OCN | SQZ | y | 28.01 | 57.38 | 99 | 27.89 | -0.43% | 2.14% |
| 2021-04-05 | TMHC | CWH | n | 31.85 | 32.48 | 82 | 31.64 | -0.66% | 2.61% |
| 2021-04-07 | OIIM | SQZ | y | 8.05 | 57.38 | 96 | 7.99 | -0.75% | 1.86% |
| 2021-04-07 | ATI | SQZ | y | 22.35 | 22.4 | 87 | 22.09 | -1.16% | 2.1% |
| 2021-04-07 | RGS | SQZ | y | 13.05 | 57.38 | 84 | 12.87 | -1.38% | 0.38% |
| 2021-04-07 | CHUY | SQZ | y | 46.38 | 47.14 | 95 | 45.56 | -1.77% | 2.74% |
| 2021-04-06 | GTHX | SQZ | y | 26.20 | 26.32 | 82 | 25.57 | -2.4% | 1.87% |
| 2021-04-07 | MXC | SQZ | y | 8.34 | 57.38 | 89 | 8.09 | -3% | 2.28% |
| 2021-04-05 | CAI | SQZ | y | 45.56 | 46.19 | 90 | 43.81 | -3.84% | 5.22% |
| 2021-04-05 | GBX | SQZ | y | 48.15 | 48.25 | 85 | 45.86 | -4.76% | 2.1% |
| 2021-04-07 | FRHC | SQZ | y | 56.32 | 57.38 | 92 | 53.59 | -4.85% | 3.16% |
| 2021-04-05 | PACB | SQZ | y | 33.83 | 34.53 | 98 | 32.16 | -4.94% | 8.63% |
| 2021-04-05 | BCYC | SQZ | y | 30.49 | 30.54 | 83 | 28.38 | -6.92% | 8.89% |
| 2021-04-08 | BCYC | CWH | y | 31.50 | 32.28 | 86 | 28.38 | -9.9% | 5.4% |
| 2021-04-05 | AKTS | SQZ | y | 14.01 | 14.08 | 81 | 12.37 | -11.71% | 2.64% |
| *RS Rank on day before breakout. | |||||||||
| Symbol | BO Price |
BO Vol. |
Company | Industry | RS Rank |
Last Close |
|---|---|---|---|---|---|---|
| CRIS | 13.00 | 2,932,340 | Curis - Inc. | Biotechnology | 99 | 11.50 |
| GSL | 17.85 | 790,896 | Global Ship Lease Inc | Marine Shipping | 92 | 13.29 |
| HBM | 8.28 | 2,039,030 | Hudbay Minerals Inc. | Copper | 90 | 7.88 |
| ENBL | 7.42 | 2,346,366 | Enable Midstream Partners - LP | Oil & Gas Midstream | 85 | 6.90 |
| LPL | 11.37 | 1,095,567 | LG Display Co - Ltd AMERIC | Consumer Electronics | 84 | 11.23 |
| These stocks meet our suggested screening factors
for our Cup and Handle Chart Pattern watchlist. See Revised Rules for Trading Cup and Handle Breakouts |
||||||
| Index | Value | Change Week | Change YTD | Trend1 |
|---|---|---|---|---|
| Dow | 33800.6 |
1.95% | 10.44% | Up |
| NASDAQ | 13900.2 |
3.12% | 7.85% | Up |
| S&P 500 | 4128.8 |
2.71% | 9.92% | Up |
|
1The Market Trend is derived from
our proprietary market model. The market model is described on
the site here.
2The site also shows industry rankings based on fundamentals, combined technical and fundamentals, and on price alone. The site also shows daily industry movements. |
||||
| 1 Week | 13 Weeks | 26 Weeks | Year-to-Date |
|---|---|---|---|
| NASDAQ Composite |
Dow Jones 5.29 |
NASDAQ Composite 20.04 |
Dow Jones 10.44 |
| 1 Week | 3 Weeks | 13 Weeks | 26 Weeks |
|---|---|---|---|
| Uranium |
Luxury Goods |
Home Improvement Retail |
| Oil & Gas Drilling 47 |
Beverages - Wineries & Distilleries 67 |
Oil & Gas E&P 98 |
REIT - Hotel & Motel 127 |
| Charts of each industry rank and performance over 12 months are available on the site | |||
If you received this newsletter from a friend and you would like to receive it regularly please go to the BreakoutWatch.com site and you will then be able to register to receive the newsletter.
Copyright (c) 04/10/2021 NBIcharts, LLC dba BreakoutWatch.com. All
rights reserved.
" BreakoutWatch," the BreakoutWatch.com "eye" logo, and the slogan
"tomorrow's breakouts today" are service marks of NBIcharts LLC. All
other marks are the property of their respective owners, and are used
for descriptive purposes only.
BreakoutWatch is not affiliated with Investor's Business Daily or with Mr. William O'Neil. Our site, research and analysis is supported entirely by subscription and is free from advertising.