Breakoutwatch Weekly Summary 04/16/21
You are receiving this email because you are or were a
BreakoutWatch.com subscriber, or have subscribed to our weekly
newsletter. This newsletter summarizes the breakout events of the week
and provides additional guidance that does not fit into our daily
format. It is published each weekend.
Newsletter Archive: https://www.breakoutwatch.com/content/newsletters
| Volatility Squeeze Breakouts
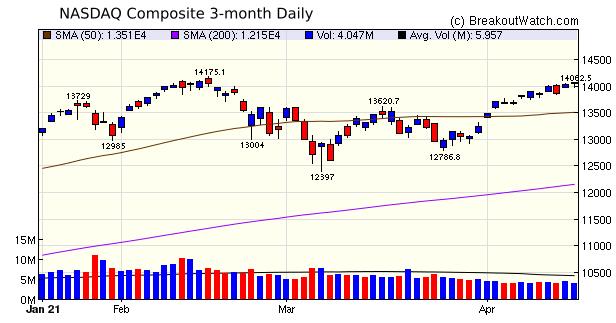
Continue to Outperform Cup and Handle The NASDAQ is within striking distance of an all time high but remains second to the S&P 500 for the week and for the year to date. Inflation fears, which held the NASDAQ back for a few weeks, have dissipated as the 10-year Treasury yield declined, and the Consumer Price Increase for March rose just 1.6% on a year-on-year basis, well below the Fed's 2% target. March retail sales were 9.8% above February's level. These factors are contributing to the overall bullish mood.  There were just 5 cup and handle
breakouts this week which made only modest gains. One reason for
the few number of breakouts, is that the number of stocks in a
cup and handle pattern has declined significantly. For example,
last Friday,04/09/20, there were just 28 stocks in the pattern.
That compares to a peak of 275 during 2020 on May 4.
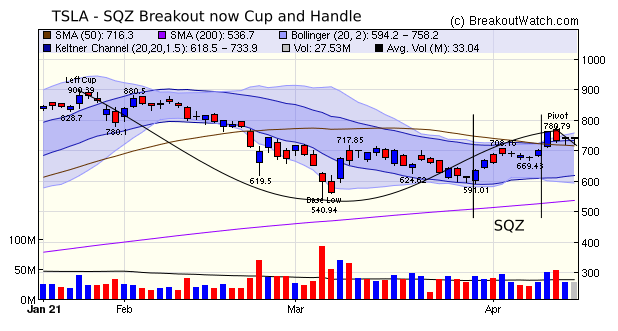
One of the interesting SQZ
breakouts was TSLA which has now formed a cup and handle.
 |
| HyreCar Inc.
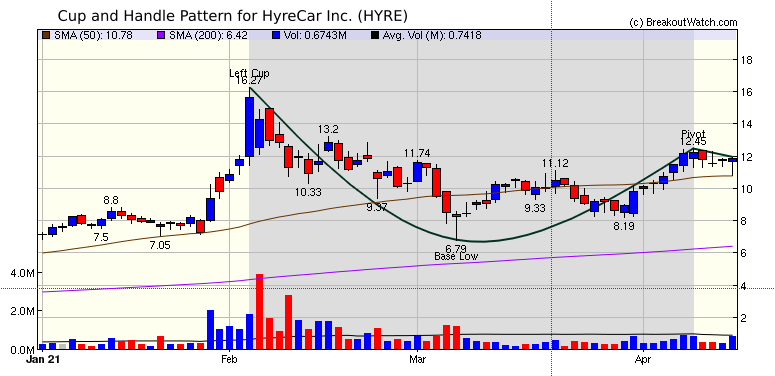
(HYRE) Here on Maui the rental car business is exploding and the companies have all raised their rates. Consequently locals are offering their cars for hire to meet the demand. As the re-opening expands, there will be increasing demand for Uber's and Lyft's and HyreCar Inc. could be well placed to capitalize on the trend. Additionally, it has an attractive 30% upside potential to its February high  |
| No new features this week |
|
Our latest strategy
suggestions are here.
|
| List | Breakouts | Avg. Gain |
|---|---|---|
| CWH | 5 | 0.86 |
| SQZ | 68 | 0.89 |
| HTF | 0 | |
| HSB | 0 | |
| DB | 7 | 2.03 |
| Brkout Date | Symbol | Base | Squeeze | Brkout Price | Brkout Day Close | RS Rank* | Last Close | Current % off BOP | Gain at Intraday High |
|---|---|---|---|---|---|---|---|---|---|
| 2021-04-13 | INVE | SQZ | y | 11.73 | 13.35 | 92 | 14.04 | 19.69% | 24.84% |
| 2021-04-14 | NEXA | SQZ | y | 10.19 | 10.72 | 84 | 11.4 | 11.87% | 12.66% |
| 2021-04-12 | STXS | SQZ | y | 7.66 | 8.33 | 88 | 8.38 | 9.4% | 12.53% |
| 2021-04-15 | NEXA | SQZ | y | 10.73 | 10.84 | 86 | 11.4 | 6.24% | 6.99% |
| 2021-04-13 | CRIS | SQZ | y | 10.83 | 11.37 | 99 | 11.49 | 6.09% | 14.04% |
| 2021-04-13 | NSTG | SQZ | y | 69.05 | 74.56 | 81 | 73.005 | 5.73% | 11.15% |
| 2021-04-13 | TSLA | SQZ | y | 701.99 | 762.32 | 97 | 738.85 | 5.25% | 11.23% |
| 2021-04-16 | HGV | SQZ | y | 40.48 | 42.58 | 84 | 42.58 | 5.19% | 6.82% |
| 2021-04-16 | NEXA | SQZ | y | 10.85 | 11.4 | 88 | 11.4 | 5.07% | 5.81% |
| 2021-04-12 | LIVE | SQZ | y | 28.01 | 30.5 | 95 | 29.41 | 5% | 13.71% |
| 2021-04-12 | USIO | SQZ | y | 6.61 | 7.13 | 97 | 6.93 | 4.84% | 14.22% |
| 2021-04-13 | WLL | SQZ | y | 34.51 | 35.04 | 99 | 36.05 | 4.46% | 5.62% |
| 2021-04-13 | PD | SQZ | y | 41.79 | 43.12 | 82 | 43.54 | 4.19% | 7.61% |
| 2021-04-14 | JELD | DB | n | 29.77 | 29.91 | 79 | 30.91 | 3.83% | 5.11% |
| 2021-04-14 | RDFN | SQZ | y | 66.40 | 66.45 | 85 | 68.91 | 3.78% | 4.61% |
| 2021-04-13 | ZS | DB | y | 189.74 | 196.65 | 87 | 195.92 | 3.26% | 5.14% |
| 2021-04-16 | DDS | SQZ | y | 95.85 | 98.88 | 96 | 98.88 | 3.16% | 4.28% |
| 2021-04-14 | INSP | DB | n | 224.36 | 224.67 | 91 | 231.46 | 3.16% | 4.74% |
| 2021-04-13 | NTRA | SQZ | y | 103.76 | 107.32 | 83 | 106.95 | 3.07% | 5.99% |
| 2021-04-16 | BRP | CWH | n | 29.78 | 30.69 | 81 | 30.69 | 3.06% | 6.35% |
| 2021-04-16 | JMP | SQZ | y | 6.57 | 6.77 | 93 | 6.77 | 3.04% | 5.02% |
| 2021-04-13 | OSTK | SQZ | y | 72.30 | 77.75 | 98 | 74.45 | 2.97% | 16.61% |
| 2021-04-16 | CBNK | SQZ | y | 20.10 | 20.64 | 85 | 20.64 | 2.69% | 3.38% |
| 2021-04-16 | NEON | SQZ | y | 8.57 | 8.8 | 81 | 8.8 | 2.68% | 4.08% |
| 2021-04-14 | STAA | CWH | n | 117.00 | 117.02 | 91 | 119.89 | 2.47% | 2.78% |
| 2021-04-14 | FANG | SQZ | y | 75.77 | 80.34 | 89 | 77.54 | 2.34% | 7.46% |
| 2021-04-14 | DOMO | SQZ | y | 59.30 | 59.32 | 89 | 60.63 | 2.24% | 5.43% |
| 2021-04-12 | FRPT | CWH | n | 168.77 | 170.48 | 82 | 172.49 | 2.2% | 3.98% |
| 2021-04-14 | TVTY | SQZ | y | 23.09 | 23.37 | 89 | 23.59 | 2.17% | 3.07% |
| 2021-04-13 | CRWD | DB | n | 210.88 | 216.35 | 81 | 215.2 | 2.05% | 3.85% |
| 2021-04-16 | BOOM | SQZ | y | 54.93 | 56.03 | 81 | 56.03 | 2% | 3.17% |
| 2021-04-12 | ASIX | SQZ | y | 28.58 | 29.04 | 90 | 29.11 | 1.85% | 4.23% |
| 2021-04-12 | DKL | SQZ | y | 37.74 | 39.75 | 91 | 38.41 | 1.78% | 5.72% |
| 2021-04-12 | MDRX | SQZ | y | 15.48 | 15.54 | 83 | 15.72 | 1.55% | 2.71% |
| 2021-04-15 | TRGP | SQZ | y | 32.85 | 33.34 | 91 | 33.34 | 1.49% | 1.92% |
| 2021-04-12 | CAI | SQZ | y | 43.82 | 45.35 | 91 | 44.39 | 1.3% | 7.53% |
| 2021-04-16 | AGYS | SQZ | y | 49.81 | 50.44 | 91 | 50.44 | 1.26% | 3.17% |
| 2021-04-13 | RGEN | DB | n | 210.99 | 212.86 | 79 | 213.57 | 1.22% | 1.9% |
| 2021-04-12 | SYX | CWH | n | 44.51 | 44.69 | 86 | 45.03 | 1.17% | 1.35% |
| 2021-04-16 | DVAX | SQZ | y | 10.87 | 10.99 | 94 | 10.99 | 1.1% | 3.04% |
| 2021-04-13 | JMP | SQZ | y | 6.70 | 6.99 | 92 | 6.77 | 1.04% | 8.66% |
| 2021-04-16 | MTH | DB | n | 97.94 | 98.79 | 75 | 98.79 | 0.87% | 1.3% |
| 2021-04-13 | ETSY | SQZ | y | 218.14 | 224.03 | 87 | 219.99 | 0.85% | 4.06% |
| 2021-04-16 | GTES | SQZ | y | 17.10 | 17.23 | 82 | 17.23 | 0.76% | 1.52% |
| 2021-04-16 | AP | SQZ | y | 6.87 | 6.92 | 82 | 6.92 | 0.73% | 2.91% |
| 2021-04-13 | EVRI | SQZ | y | 14.27 | 14.3 | 87 | 14.36 | 0.63% | 3.19% |
| 2021-04-16 | NTRA | SQZ | y | 106.36 | 106.95 | 88 | 106.95 | 0.55% | 0.67% |
| 2021-04-16 | CMA | SQZ | y | 69.78 | 70.16 | 85 | 70.16 | 0.54% | 2.62% |
| 2021-04-13 | GWPH | SQZ | y | 217.78 | 218 | 87 | 218.9 | 0.51% | 0.56% |
| 2021-04-16 | DXPE | SQZ | y | 30.08 | 30.23 | 80 | 30.23 | 0.5% | 1.36% |
| 2021-04-12 | CTB | SQZ | y | 56.82 | 57.02 | 87 | 57.09 | 0.48% | 0.97% |
| 2021-04-16 | ETSY | SQZ | y | 219.30 | 219.99 | 90 | 219.99 | 0.31% | 0.84% |
| 2021-04-15 | GWPH | SQZ | y | 218.37 | 218.81 | 89 | 218.9 | 0.24% | 0.29% |
| 2021-04-16 | EVRI | SQZ | y | 14.33 | 14.36 | 90 | 14.36 | 0.21% | 1.54% |
| 2021-04-13 | TWTR | DB | n | 71.86 | 72.45 | 89 | 71.71 | -0.21% | 1.88% |
| 2021-04-13 | RBBN | SQZ | y | 8.52 | 8.53 | 93 | 8.47 | -0.59% | 2.35% |
| 2021-04-13 | RWT | SQZ | y | 10.36 | 10.39 | 86 | 10.29 | -0.68% | 1.93% |
| 2021-04-14 | LTHM | SQZ | y | 16.80 | 17.36 | 85 | 16.6 | -1.19% | 4.94% |
| 2021-04-15 | MSON | SQZ | y | 19.88 | 19.99 | 81 | 19.64 | -1.21% | 1.51% |
| 2021-04-13 | ENPH | SQZ | y | 151.88 | 153.09 | 87 | 150.01 | -1.23% | 3.4% |
| 2021-04-12 | RF | SQZ | y | 21.24 | 21.42 | 81 | 20.97 | -1.27% | 1.22% |
| 2021-04-12 | DDS | SQZ | y | 100.18 | 101.02 | 96 | 98.88 | -1.3% | 1.25% |
| 2021-04-14 | VVI | SQZ | y | 41.00 | 41.43 | 83 | 40.34 | -1.61% | 5.22% |
| 2021-04-13 | STKL | SQZ | y | 15.04 | 15.37 | 98 | 14.77 | -1.8% | 5.39% |
| 2021-04-12 | CMA | SQZ | y | 71.50 | 72.25 | 84 | 70.16 | -1.87% | 1.58% |
| 2021-04-14 | RGS | SQZ | y | 12.72 | 12.84 | 82 | 12.48 | -1.89% | 4.01% |
| 2021-04-12 | PRPL | SQZ | y | 34.02 | 34.14 | 90 | 33.35 | -1.97% | 3.2% |
| 2021-04-12 | SKY | SQZ | y | 46.29 | 46.63 | 87 | 45.34 | -2.05% | 2.31% |
| 2021-04-12 | HYRE | SQZ | y | 12.17 | 12.25 | 98 | 11.86 | -2.55% | 2.3% |
| 2021-04-14 | TPIC | SQZ | y | 52.85 | 53.24 | 87 | 51.48 | -2.59% | 2.82% |
| 2021-04-13 | USIO | SQZ | y | 7.14 | 7.19 | 98 | 6.93 | -2.94% | 5.74% |
| 2021-04-15 | CRIS | SQZ | y | 11.88 | 12.21 | 99 | 11.49 | -3.28% | 3.96% |
| 2021-04-12 | CUTR | SQZ | y | 31.41 | 31.54 | 88 | 30.17 | -3.95% | 2.67% |
| 2021-04-14 | HEAR | SQZ | y | 26.81 | 26.82 | 90 | 25.62 | -4.44% | 1.72% |
| 2021-04-12 | GBX | SQZ | y | 45.87 | 46.38 | 85 | 43.8 | -4.51% | 1.64% |
| 2021-04-15 | HBM | CWH | n | 8.28 | 8.42 | 91 | 7.9 | -4.59% | 3.14% |
| 2021-04-13 | FVRR | SQZ | y | 226.67 | 232.7 | 95 | 216.17 | -4.63% | 5.34% |
| 2021-04-13 | CASA | SQZ | y | 9.65 | 9.71 | 87 | 8.76 | -9.22% | 9.53% |
| 2021-04-12 | ACTG | SQZ | y | 6.57 | 6.68 | 88 | 5.96 | -9.28% | 4.41% |
| 2021-04-13 | SI | SQZ | y | 162.85 | 166.49 | 99 | 139.09 | -14.59% | 6.21% |
| *RS Rank on day before breakout. | |||||||||
| Symbol | BO Price |
BO Vol. |
Company | Industry | RS Rank |
Last Close |
|---|---|---|---|---|---|---|
| HYRE | 12.45 | 1,112,660 | HyreCar Inc. | Rental & Leasing Services | 98 | 11.86 |
| STKL | 15.96 | 1,557,134 | SunOpta - Inc. | Packaged Foods | 97 | 14.77 |
| AIV | 6.50 | 6,116,493 | Apartment Investment and Management Company | REIT - Residential | 88 | 6.38 |
| SIM | 14.65 | 223,505,106 | Grupo Simec - S.A.B. de C. | Steel | 84 | 14.09 |
| LPL | 11.37 | 996,158 | LG Display Co - Ltd AMERIC | Consumer Electronics | 83 | 10.95 |
| PSEC | 8.04 | 4,255,665 | Prospect Capital Corporation | Asset Management | 82 | 8.00 |
| SSSS | 16.15 | 612,120 | SuRo Capital Corp. | Asset Management | 81 | 15.48 |
| SVC | 13.91 | 1,238,241 | Service Properties Trust | REIT - Hotel & Motel | 80 | 12.40 |
| These stocks meet our suggested screening factors
for our Cup and Handle Chart Pattern watchlist. See Revised Rules for Trading Cup and Handle Breakouts |
||||||
| Index | Value | Change Week | Change YTD | Trend1 |
|---|---|---|---|---|
| Dow | 34200.7 |
1.18% | 11.74% | Up |
| NASDAQ | 14052.3 |
1.09% | 9.03% | Up |
| S&P 500 | 4185.47 |
1.37% | 11.43% | Up |
|
1The Market Trend is derived from
our proprietary market model. The market model is described on
the site here.
2The site also shows industry rankings based on fundamentals, combined technical and fundamentals, and on price alone. The site also shows daily industry movements. |
||||
| 1 Week | 13 Weeks | 26 Weeks | Year-to-Date |
|---|---|---|---|
| S&P 500 |
S&P 500 8.11 |
NASDAQ Composite 20.4 |
Dow Jones 11.74 |
| 1 Week | 3 Weeks | 13 Weeks | 26 Weeks |
|---|---|---|---|
| Aluminum |
Luxury Goods |
Utilities - Renewable |
| Beverages - Brewers 34 |
Chemicals 47 |
Airlines 89 |
Airlines 125 |
| Charts of each industry rank and performance over 12 months are available on the site | |||
If you received this newsletter from a friend and you would like to receive it regularly please go to the BreakoutWatch.com site and you will then be able to register to receive the newsletter.
Copyright (c) 04/16/2021 NBIcharts, LLC dba BreakoutWatch.com. All
rights reserved.
" BreakoutWatch," the BreakoutWatch.com "eye" logo, and the slogan
"tomorrow's breakouts today" are service marks of NBIcharts LLC. All
other marks are the property of their respective owners, and are used
for descriptive purposes only.
BreakoutWatch is not affiliated with Investor's Business Daily or with Mr. William O'Neil. Our site, research and analysis is supported entirely by subscription and is free from advertising.