Breakoutwatch Weekly Summary 04/24/21
You are receiving this email because you are or were a
BreakoutWatch.com subscriber, or have subscribed to our weekly
newsletter. This newsletter summarizes the breakout events of the week
and provides additional guidance that does not fit into our daily
format. It is published each weekend.
Newsletter Archive: https://www.breakoutwatch.com/content/newsletters
New To Newsweek Readers: CwH Stocks Likely to Close above BoP at Next Session (see below).
| Market Consolidation Creates Many
Breakout Opportunities Prior to this week's open, the NASDAQ had risen 8.2% since it's last dip on March 25 and at it's high on April 16, was well above the Average True Range as the chart shows. Consequently, we saw some profit taking as the market consolidated and the NASDAQ closed down 0.25% for the week. Notably, the index reverted to the recent 'buy the dip' mentality after Wednesday's slide on the news that capital gains tax would rise for millionaires. The index closed the week with a strong 1.4% rally. 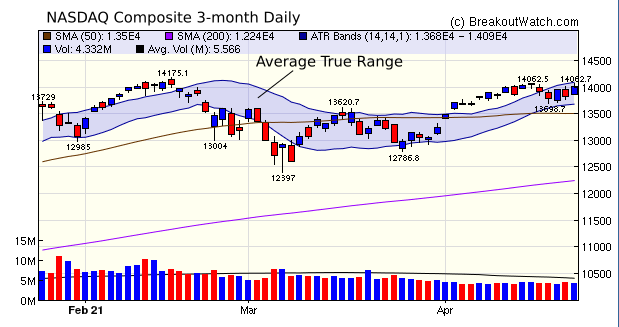 The pull back at the beginning of
the week created several short handles for the cup and handle
pattern with the result that there was in increase, to 14, in
cup and handle breakouts generating an average gain of 3.8%.
Volatility Squeeze situations were also in abundance creating
107 breakouts at an average gain of 2.5%.
|
| Last week's Chart
of the Week, HYRE, broke out on Wednesday and gained 9.7% by
Friday's close. Unfortunately, it did not appear on Tuesday's
CWH watchlist, as it no longer met our criteria for that
pattern. Lazydays Holdings, INC. (LAZY) Lazydays Holdings, Inc. operates recreation vehicle (RV) dealerships under the Lazydays name in the United States. It provides RV sales, RV parts and services, after-market parts and accessories, and RV camping facilities. The stock rose to a pivot on April 14 after 5 days of substantial above average volume. Profit taking then set up a classic handle with a move up the right side of the handle on above average volume 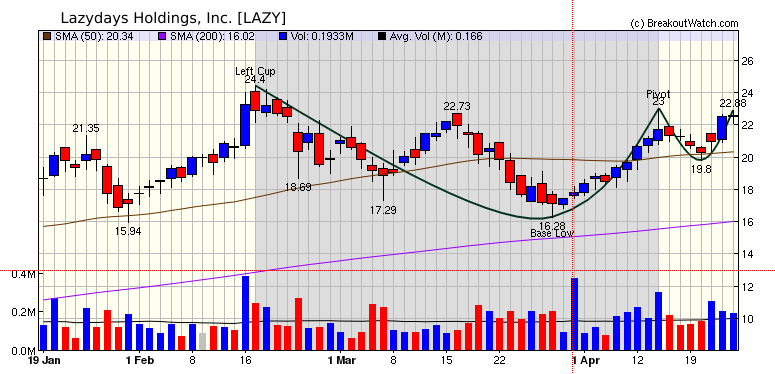 |
| No new features this week |
|
Our latest strategy
suggestions are here.
|
| List | Breakouts | Avg. Gain |
|---|---|---|
| CWH | 14 | 3.78 |
| SQZ | 107 | 2.54 |
| HTF | 2 | 2.38 |
| HSB | 0 | |
| DB | 10 | 2.71 |
| Brkout Date | Symbol | Base | Squeeze | Brkout Price | Brkout Day Close | RS Rank* | Last Close | Current % off BOP | Gain at Intraday High |
|---|---|---|---|---|---|---|---|---|---|
| 2021-04-22 | DQ | SQZ | y | 74.90 | 85.6 | 98 | 89.51 | 19.51% | 19.89% |
| 2021-04-19 | HEAR | SQZ | y | 25.63 | 25.73 | 86 | 29.38 | 14.63% | 16.5% |
| 2021-04-21 | STAA | CWH | n | 120.25 | 128.84 | 92 | 133.8 | 11.27% | 12.27% |
| 2021-04-19 | CBNK | SQZ | y | 20.65 | 21.88 | 86 | 22.77 | 10.27% | 11.23% |
| 2021-04-19 | LTHM | SQZ | y | 16.61 | 17.59 | 84 | 18.19 | 9.51% | 11.5% |
| 2021-04-21 | SWAV | CWH | n | 146.07 | 153.48 | 94 | 159.38 | 9.11% | 11.3% |
| 2021-04-22 | CDLX | SQZ | y | 119.67 | 124.54 | 82 | 129.85 | 8.51% | 10.2% |
| 2021-04-19 | PLT | SQZ | y | 37.73 | 37.95 | 92 | 40.71 | 7.9% | 9.2% |
| 2021-04-22 | ENPH | SQZ | y | 155.09 | 160.88 | 92 | 166.97 | 7.66% | 8.49% |
| 2021-04-21 | DDS | SQZ | y | 93.70 | 98.13 | 96 | 100.85 | 7.63% | 9.27% |
| 2021-04-23 | COTY | SQZ | y | 9.21 | 9.91 | 91 | 9.91 | 7.6% | 10.31% |
| 2021-04-21 | CCRN | SQZ | y | 12.68 | 12.98 | 88 | 13.63 | 7.49% | 9.45% |
| 2021-04-22 | ACBI | SQZ | y | 24.55 | 24.59 | 89 | 26.22 | 6.8% | 10.88% |
| 2021-04-22 | LPL | CWH | n | 11.37 | 11.64 | 84 | 12.12 | 6.6% | 6.95% |
| 2021-04-22 | RELL | CWH | n | 8.00 | 8.04 | 84 | 8.52 | 6.5% | 8.88% |
| 2021-04-22 | SBOW | SQZ | y | 8.54 | 9.15 | 89 | 9.09 | 6.44% | 10.54% |
| 2021-04-22 | HEAR | SQZ | y | 27.63 | 27.75 | 86 | 29.38 | 6.33% | 8.07% |
| 2021-04-19 | ATLC | DB | n | 32.99 | 34.97 | 94 | 34.95 | 5.94% | 10.35% |
| 2021-04-23 | HEAR | SQZ | y | 27.76 | 29.38 | 86 | 29.38 | 5.84% | 7.56% |
| 2021-04-21 | SITC | CWH | n | 14.20 | 14.48 | 90 | 14.97 | 5.42% | 5.56% |
| 2021-04-22 | ALB | SQZ | y | 153.06 | 155.8 | 80 | 161.23 | 5.34% | 9.67% |
| 2021-04-22 | GOGO | SQZ | y | 10.31 | 10.54 | 96 | 10.85 | 5.24% | 7.52% |
| 2021-04-22 | ERII | SQZ | y | 20.61 | 20.74 | 93 | 21.68 | 5.19% | 6.6% |
| 2021-04-23 | KRUS | SQZ | y | 33.72 | 35.46 | 95 | 35.46 | 5.16% | 5.34% |
| 2021-04-22 | CCRN | SQZ | y | 12.99 | 13.43 | 87 | 13.63 | 4.93% | 6.84% |
| 2021-04-23 | ALPN | SQZ | y | 11.51 | 12.07 | 83 | 12.07 | 4.87% | 8.34% |
| 2021-04-23 | CLFD | DB | n | 35.08 | 36.73 | 80 | 36.73 | 4.7% | 5.16% |
| 2021-04-22 | ARLP | SQZ | y | 6.25 | 6.33 | 85 | 6.54 | 4.64% | 4.8% |
| 2021-04-23 | QFIN | SQZ | y | 25.72 | 26.9 | 93 | 26.9 | 4.59% | 5.93% |
| 2021-04-22 | GKOS | DB | y | 90.85 | 91.75 | 87 | 94.99 | 4.56% | 5.71% |
| 2021-04-21 | RPT | SQZ | y | 12.08 | 12.29 | 91 | 12.63 | 4.55% | 4.55% |
| 2021-04-23 | CDLX | SQZ | y | 124.55 | 129.85 | 85 | 129.85 | 4.26% | 5.88% |
| 2021-04-19 | PLYA | SQZ | y | 7.29 | 7.35 | 89 | 7.6 | 4.25% | 6.04% |
| 2021-04-22 | WWW | SQZ | y | 39.97 | 40.74 | 81 | 41.63 | 4.15% | 4.65% |
| 2021-04-23 | CNOB | SQZ | y | 26.12 | 27.13 | 82 | 27.13 | 3.87% | 4.9% |
| 2021-04-22 | MCFT | DB | n | 28.35 | 28.47 | 81 | 29.44 | 3.84% | 4.8% |
| 2021-04-23 | PLL | SQZ | y | 67.22 | 69.77 | 99 | 69.77 | 3.79% | 5.31% |
| 2021-04-23 | NIO | SQZ | y | 39.58 | 41.08 | 98 | 41.08 | 3.79% | 4.09% |
| 2021-04-22 | TRGP | SQZ | y | 32.72 | 32.77 | 92 | 33.94 | 3.73% | 3.79% |
| 2021-04-23 | HUBS | CWH | n | 544.41 | 564.63 | 93 | 564.63 | 3.71% | 3.77% |
| 2021-04-23 | OPRX | SQZ | y | 48.54 | 50.34 | 96 | 50.34 | 3.71% | 5.58% |
| 2021-04-22 | BY | SQZ | y | 21.60 | 21.65 | 82 | 22.4 | 3.7% | 4.17% |
| 2021-04-23 | TRGP | SQZ | y | 32.78 | 33.94 | 92 | 33.94 | 3.54% | 3.6% |
| 2021-04-23 | ALB | SQZ | y | 155.81 | 161.23 | 82 | 161.23 | 3.48% | 7.73% |
| 2021-04-21 | KRG | SQZ | y | 19.85 | 20.25 | 88 | 20.54 | 3.48% | 4.18% |
| 2021-04-21 | SMED | SQZ | y | 15.37 | 15.62 | 92 | 15.9 | 3.45% | 4.68% |
| 2021-04-23 | BY | SQZ | y | 21.66 | 22.4 | 82 | 22.4 | 3.42% | 3.88% |
| 2021-04-23 | MCFT | SQZ | y | 28.48 | 29.44 | 86 | 29.44 | 3.37% | 4.32% |
| 2021-04-23 | DFS | SQZ | y | 99.51 | 102.84 | 87 | 102.84 | 3.35% | 3.58% |
| 2021-04-22 | DOMO | SQZ | y | 62.18 | 62.55 | 91 | 64.23 | 3.3% | 5.77% |
| 2021-04-23 | THO | SQZ | y | 137.01 | 140.94 | 81 | 140.94 | 2.87% | 3.62% |
| 2021-04-23 | GOGO | SQZ | y | 10.55 | 10.85 | 96 | 10.85 | 2.84% | 5.07% |
| 2021-04-21 | EPRT | CWH | n | 25.37 | 25.85 | 82 | 26.08 | 2.8% | 5.24% |
| 2021-04-22 | DDS | SQZ | y | 98.14 | 99.77 | 96 | 100.85 | 2.76% | 4.33% |
| 2021-04-23 | CIGI | SQZ | y | 103.81 | 106.66 | 81 | 106.66 | 2.75% | 3.15% |
| 2021-04-23 | KRA | SQZ | y | 37.86 | 38.89 | 92 | 38.89 | 2.72% | 3.78% |
| 2021-04-21 | MDRX | DB | y | 15.91 | 15.92 | 82 | 16.34 | 2.7% | 3.74% |
| 2021-04-23 | DOMO | SQZ | y | 62.56 | 64.23 | 91 | 64.23 | 2.67% | 4.49% |
| 2021-04-21 | AIV | CWH | n | 6.50 | 6.53 | 91 | 6.67 | 2.62% | 4% |
| 2021-04-22 | ICLK | SQZ | y | 13.20 | 13.27 | 86 | 13.53 | 2.5% | 3.03% |
| 2021-04-23 | DY | SQZ | y | 94.34 | 96.62 | 90 | 96.62 | 2.42% | 3.42% |
| 2021-04-22 | QRTEA | SQZ | y | 11.97 | 12.13 | 86 | 12.26 | 2.42% | 3.97% |
| 2021-04-23 | AFMD | HTF | n | 10.78 | 11.04 | 97 | 11.04 | 2.41% | 5.57% |
| 2021-04-23 | RPT | SQZ | y | 12.34 | 12.63 | 90 | 12.63 | 2.35% | 2.35% |
| 2021-04-21 | LEE | HTF | n | 31.24 | 31.41 | 99 | 31.97 | 2.34% | 9.65% |
| 2021-04-22 | ETSY | SQZ | y | 209.77 | 210.28 | 88 | 214.59 | 2.3% | 3.33% |
| 2021-04-23 | WWW | SQZ | y | 40.75 | 41.63 | 84 | 41.63 | 2.16% | 2.65% |
| 2021-04-20 | VER | CWH | n | 41.03 | 41.31 | 99 | 41.91 | 2.14% | 2.41% |
| 2021-04-22 | THC | SQZ | y | 54.54 | 56.18 | 89 | 55.7 | 2.13% | 5.76% |
| 2021-04-23 | ABR | DB | y | 16.91 | 17.27 | 88 | 17.27 | 2.13% | 2.37% |
| 2021-04-19 | SPG | SQZ | y | 114.58 | 116.56 | 82 | 116.92 | 2.04% | 3.9% |
| 2021-04-23 | IIIN | SQZ | y | 34.25 | 34.93 | 85 | 34.93 | 1.99% | 3.33% |
| 2021-04-23 | ATKR | SQZ | y | 74.76 | 76.23 | 96 | 76.23 | 1.97% | 2.81% |
| 2021-04-23 | ICLK | SQZ | y | 13.28 | 13.53 | 87 | 13.53 | 1.88% | 2.41% |
| 2021-04-23 | MBUU | SQZ | y | 84.49 | 86.08 | 86 | 86.08 | 1.88% | 3.44% |
| 2021-04-21 | SRT | SQZ | y | 8.11 | 8.28 | 84 | 8.26 | 1.85% | 3.45% |
| 2021-04-23 | LTHM | SQZ | y | 17.87 | 18.19 | 89 | 18.19 | 1.79% | 3.64% |
| 2021-04-19 | CAPL | CWH | n | 19.82 | 19.87 | 81 | 20.17 | 1.77% | 1.77% |
| 2021-04-22 | AKR | SQZ | y | 20.59 | 20.6 | 86 | 20.93 | 1.65% | 1.99% |
| 2021-04-23 | STXB | DB | y | 23.62 | 24 | 87 | 24 | 1.61% | 1.61% |
| 2021-04-23 | REZI | SQZ | y | 29.86 | 30.34 | 97 | 30.34 | 1.61% | 3.04% |
| 2021-04-22 | HBI | SQZ | y | 20.60 | 20.64 | 81 | 20.93 | 1.6% | 2.18% |
| 2021-04-23 | CSU | SQZ | y | 40.21 | 40.83 | 97 | 40.83 | 1.54% | 3.21% |
| 2021-04-23 | NOVA | SQZ | y | 39.31 | 39.91 | 84 | 39.91 | 1.53% | 3.43% |
| 2021-04-23 | TTGT | SQZ | y | 75.06 | 76.15 | 91 | 76.15 | 1.45% | 2.65% |
| 2021-04-22 | M | SQZ | y | 16.68 | 16.9 | 94 | 16.92 | 1.44% | 3.9% |
| 2021-04-23 | SKT | SQZ | y | 16.74 | 16.98 | 94 | 16.98 | 1.43% | 2.03% |
| 2021-04-23 | CCRN | SQZ | y | 13.44 | 13.63 | 88 | 13.63 | 1.41% | 2.98% |
| 2021-04-23 | OMCL | SQZ | y | 137.74 | 139.62 | 82 | 139.62 | 1.36% | 2.13% |
| 2021-04-19 | WMS | CWH | n | 113.51 | 113.98 | 91 | 115.01 | 1.32% | 3.86% |
| 2021-04-23 | FATE | SQZ | y | 84.24 | 85.34 | 88 | 85.34 | 1.31% | 4.9% |
| 2021-04-21 | MDP | SQZ | y | 30.75 | 31.17 | 94 | 31.15 | 1.3% | 5.2% |
| 2021-04-21 | NMRK | SQZ | y | 10.44 | 10.83 | 94 | 10.57 | 1.25% | 3.83% |
| 2021-04-21 | APYX | SQZ | y | 9.89 | 10.02 | 85 | 10 | 1.11% | 3.34% |
| 2021-04-23 | PRPL | CWH | n | 35.39 | 35.78 | 85 | 35.78 | 1.1% | 1.64% |
| 2021-04-23 | DDS | SQZ | y | 99.78 | 100.85 | 97 | 100.85 | 1.07% | 1.72% |
| 2021-04-23 | ORRF | SQZ | y | 23.51 | 23.75 | 82 | 23.75 | 1.02% | 2.51% |
| 2021-04-23 | QRTEA | SQZ | y | 12.14 | 12.26 | 87 | 12.26 | 0.99% | 1.57% |
| 2021-04-23 | RC | SQZ | y | 14.32 | 14.46 | 80 | 14.46 | 0.98% | 1.57% |
| 2021-04-22 | LCUT | SQZ | y | 14.80 | 14.9 | 85 | 14.94 | 0.95% | 2.26% |
| 2021-04-22 | MAT | SQZ | y | 20.86 | 20.88 | 84 | 21.05 | 0.91% | 11.74% |
| 2021-04-23 | ENBL | SQZ | y | 6.92 | 6.98 | 83 | 6.98 | 0.87% | 1.3% |
| 2021-04-19 | GTES | SQZ | y | 17.24 | 17.4 | 80 | 17.39 | 0.87% | 1.62% |
| 2021-04-23 | TVTY | SQZ | y | 24.01 | 24.21 | 90 | 24.21 | 0.83% | 2.37% |
| 2021-04-23 | SBGI | SQZ | y | 32.37 | 32.62 | 81 | 32.62 | 0.77% | 1.64% |
| 2021-04-23 | GTLS | DB | n | 151.67 | 152.79 | 95 | 152.79 | 0.74% | 2.1% |
| 2021-04-23 | VECO | DB | n | 22.44 | 22.6 | 78 | 22.6 | 0.71% | 0.89% |
| 2021-04-23 | WOW | SQZ | y | 14.17 | 14.27 | 93 | 14.27 | 0.71% | 2.75% |
| 2021-04-23 | ACRE | SQZ | y | 14.28 | 14.36 | 84 | 14.36 | 0.56% | 1.33% |
| 2021-04-23 | IMBI | SQZ | y | 7.59 | 7.62 | 92 | 7.62 | 0.4% | 1.21% |
| 2021-04-19 | TLND | SQZ | y | 63.94 | 63.95 | 87 | 64.08 | 0.22% | 0.51% |
| 2021-04-23 | LCUT | SQZ | y | 14.91 | 14.94 | 85 | 14.94 | 0.2% | 1.51% |
| 2021-04-21 | TLND | SQZ | y | 63.98 | 64 | 89 | 64.08 | 0.16% | 0.45% |
| 2021-04-21 | HBB | DB | n | 20.81 | 20.87 | 74 | 20.84 | 0.14% | 2.02% |
| 2021-04-23 | CBRE | CWH | n | 82.83 | 82.9 | 84 | 82.9 | 0.08% | 0.62% |
| 2021-04-23 | M | SQZ | y | 16.91 | 16.92 | 94 | 16.92 | 0.06% | 0.87% |
| 2021-04-19 | JMP | SQZ | y | 6.78 | 6.9 | 94 | 6.78 | 0% | 3.98% |
| 2021-04-22 | MDP | SQZ | y | 31.18 | 31.61 | 93 | 31.15 | -0.1% | 3.75% |
| 2021-04-19 | VVI | SQZ | y | 40.35 | 40.54 | 83 | 40.15 | -0.5% | 0.57% |
| 2021-04-19 | RYAM | SQZ | y | 9.43 | 9.56 | 98 | 9.38 | -0.53% | 2.86% |
| 2021-04-19 | WSFS | SQZ | y | 49.93 | 51.04 | 80 | 49.66 | -0.54% | 2.32% |
| 2021-04-19 | MTDR | SQZ | y | 23.99 | 24.43 | 98 | 23.85 | -0.58% | 2.54% |
| 2021-04-20 | GLP | SQZ | y | 21.90 | 21.94 | 90 | 21.71 | -0.87% | 1.37% |
| 2021-04-19 | RHP | SQZ | y | 77.04 | 78.19 | 88 | 75.94 | -1.43% | 1.64% |
| 2021-04-21 | FRPT | CWH | n | 175.48 | 175.52 | 83 | 172.69 | -1.59% | 1.11% |
| 2021-04-19 | WLL | SQZ | y | 36.06 | 36.65 | 99 | 35.48 | -1.61% | 2.02% |
| 2021-04-19 | NTP | SQZ | y | 12.16 | 12.97 | 90 | 11.95 | -1.73% | 10.77% |
| 2021-04-19 | GPRK | SQZ | y | 16.46 | 16.54 | 83 | 16.14 | -1.94% | 2.19% |
| 2021-04-20 | IKNX | SQZ | y | 9.99 | 10.15 | 93 | 9.71 | -2.8% | 3% |
| 2021-04-22 | BJRI | SQZ | y | 59.21 | 60.42 | 94 | 57 | -3.73% | 4.1% |
| 2021-04-19 | NOG | SQZ | y | 12.79 | 12.92 | 99 | 12.22 | -4.46% | 3.21% |
| 2021-04-22 | RUBY | SQZ | y | 26.88 | 27.96 | 99 | 24.66 | -8.26% | 11.38% |
| 2021-04-19 | BOOM | SQZ | y | 56.04 | 56.58 | 82 | 50 | -10.78% | 2.27% |
| *RS Rank on day before breakout. | |||||||||
| Symbol | BO Price |
BO Vol. |
Company | Industry | RS Rank |
Last Close |
|---|---|---|---|---|---|---|
| DVAX | 11.84 | 5,081,470 | Dynavax Technologies Corporation | Biotechnology | 91 | 9.59 |
| STXS | 8.62 | 220,566,844 | Stereotaxis - Inc. | Medical Instruments & Supplies | 90 | 7.74 |
| HBM | 8.54 | 2,136,582 | Hudbay Minerals Inc. | Copper | 88 | 7.35 |
| PLX | 6.37 | 349,871,223 | Protalix BioTherapeutics - Inc. | Biotechnology | 80 | 6.22 |
| These stocks meet our suggested screening factors
for our Cup and Handle Chart Pattern watchlist. See Revised Rules for Trading Cup and Handle Breakouts |
||||||
|
This list is revised every day and sent to our subscribers. Newsletter readers can now see the list for the next session (usually a Monday). To see the list every day, please subscribe to the site. |
||||||
| Symbol | Company | Industry | RS Rank | Last Close | BoP | % off BoP |
|---|---|---|---|---|---|---|
| ESTA | Establishment Labs Holdings Inc. | Medical Devices | 97 | 74.11 | 75.19 | 98.56 |
| LAZY | Lazydays Holdings, Inc. | Auto & Truck Dealerships | 98 | 22.57 | 23.00 | 98.13 |
| VRTS | Virtus Investment Partners, Inc. | Asset Management | 89 | 256.81 | 260.20 | 98.7 |
| CELH | Celsius Holdings, Inc. | Beverages - Non-Alcoholic | 99 | 59.63 | 61.00 | 97.75 |
| SE | Sea Limited American Depo | Electronic Gaming & Multimedia | 94 | 258.59 | 261.55 | 98.87 |
| PGNY | Progyny, Inc. | Health Information Services | 85 | 53.19 | 53.47 | 99.48 |
| INSP | Inspire Medical Systems, Inc. | Medical Devices | 90 | 227.68 | 235.00 | 96.89 |
| WMS | Advanced Drainage Systems, Inc. | Building Products & Equipment | 91 | 115.01 | 117.89 | 97.56 |
| NSTG | NanoString Technologies, Inc. | Biotechnology | 87 | 76.105 | 76.75 | 99.16 |
| NUAN | Nuance Communications, Inc. | Software - Application | 86 | 53.09 | 53.93 | 98.44 |
| HHC | Howard Hughes Corporation (The) | Real Estate - Diversified | 82 | 105.93 | 107.78 | 98.28 |
| TXG | 10x Genomics, Inc. | Health Information Services | 83 | 193.95 | 203.08 | 95.5 |
| TECK | Teck Resources Ltd Ordina | Other Industrial Metals & Mining | 86 | 21.91 | 22.82 | 96.01 |
| SNAP | Snap Inc. | Internet Content & Information | 93 | 61.3 | 65.85 | 93.09 |
| BLD | TopBuild Corp. | Engineering & Construction | 83 | 225 | 235.50 | 95.54 |
| PTC | PTC Inc. | Software - Application | 81 | 147.34 | 149.27 | 98.71 |
| ZBRA | Zebra Technologies Corporation | Communication Equipment | 84 | 497.41 | 518.66 | 95.9 |
| HZNP | Horizon Therapeutics Public Limited Company | Drug Manufacturers - General | 83 | 94.63 | 95.83 | 98.75 |
| *These stocks were selected using our price breakout model. This model correctly selected CWH stocks that met or exceeded their breakout price with 80% probability over Jan. 2019 to Nov. 2020. This does not imply that on any one day, 80% or any of the stocks selected will meet or exceed their breakout price. | ||||||
| Index | Value | Change Week | Change YTD | Trend1 |
|---|---|---|---|---|
| Dow | 34043.5 |
-0.46% | 11.23% | Up |
| NASDAQ | 14016.8 |
-0.25% | 8.76% | Up |
| S&P 500 | 4180.17 |
-0.13% | 11.29% | Up |
|
1The Market Trend is derived from
our proprietary market model. The market model is described on
the site here.
2The site also shows industry rankings based on fundamentals, combined technical and fundamentals, and on price alone. The site also shows daily industry movements. |
||||
| 1 Week | 13 Weeks | 26 Weeks | Year-to-Date |
|---|---|---|---|
| S&P 500 |
Dow Jones 3.5 |
NASDAQ Composite 21.38 |
S&P 500 11.29 |
| 1 Week | 3 Weeks | 13 Weeks | 26 Weeks |
|---|---|---|---|
| Aluminum |
Luxury Goods |
Utilities - Renewable |
| Textile Manufacturing 93 |
Textile Manufacturing 99 |
Airlines 93 |
Airports & Air Services 126 |
| Charts of each industry rank and performance over 12 months are available on the site | |||
If you received this newsletter from a friend and you would like to receive it regularly please go to the BreakoutWatch.com site and you will then be able to register to receive the newsletter.
Copyright (c) 04/24/2021 NBIcharts, LLC dba BreakoutWatch.com. All
rights reserved.
" BreakoutWatch," the BreakoutWatch.com "eye" logo, and the slogan
"tomorrow's breakouts today" are service marks of NBIcharts LLC. All
other marks are the property of their respective owners, and are used
for descriptive purposes only.
BreakoutWatch is not affiliated with Investor's Business Daily or with Mr. William O'Neil. Our site, research and analysis is supported entirely by subscription and is free from advertising.