Breakoutwatch Weekly Summary 05/08/21
You are receiving this email because you are or were a
BreakoutWatch.com subscriber, or have subscribed to our weekly
newsletter. This newsletter summarizes the breakout events of the week
and provides additional guidance that does not fit into our daily
format. It is published each weekend.
Newsletter Archive: https://www.breakoutwatch.com/content/newsletters
| 280 Breakouts This Week; 62 gain
more than 5% The NASDAQ consolidation continued this week until the economic data released on Friday showed the recovery may be slowing. The market's found this to be good news, as it indicated that further stimulus may be needed. The result was that the NASDAQ gapped up at the open and reduced what could have been a 3.8% loss to just negative 1.5%. In contrast the DJI and S&P 500 closed the week at new highs, indicating that tech stocks were out of favor in relation to cyclicals such as energy (+8.9%), materials (+5.9%), financials (+4.2%), and industrials (+3.6%). This rotation was also apparent in the breakout counts with the NYSE and AMEX exchanges accounting for 75 of the 62 breakouts that closed with a gain of 5% or more. 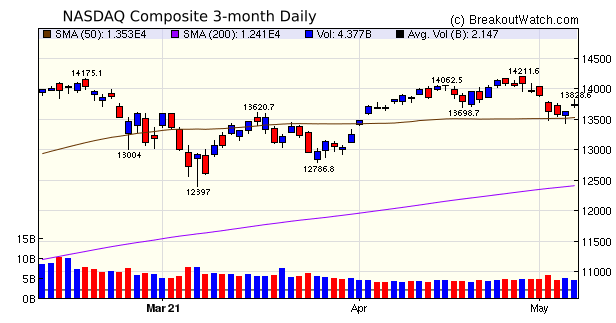 |
| Last week's
suggestion of AVID took until Thursday to breakout but since
then it a has gained 28.6% With so many stocks at, or near their all time highs, it is difficult to find cup and handle pattern stocks that still have headroom to move. This weeks selection is MasterCraft Boat Holdings, Inc. (MCFT). MCFT ranks second on our list of stocks likely to breakout at the next session (see the full list below). 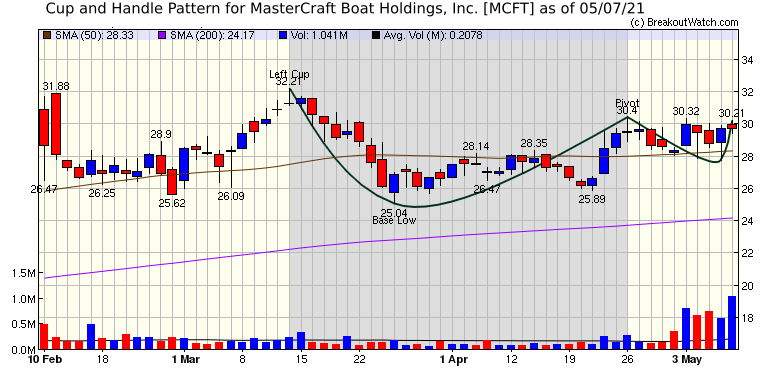 |
I've made a change to the filter
behavior for the Cup and Handle watchlist. If you select to
filter on "Predicted to Close Above BoP" then only stocks that
meet the price model breakout criteria will be selected. The
additional filter values will not be used. The main advantage of
this filter is to allow the charts that have this criterion can
be easily scanned in the chart browser.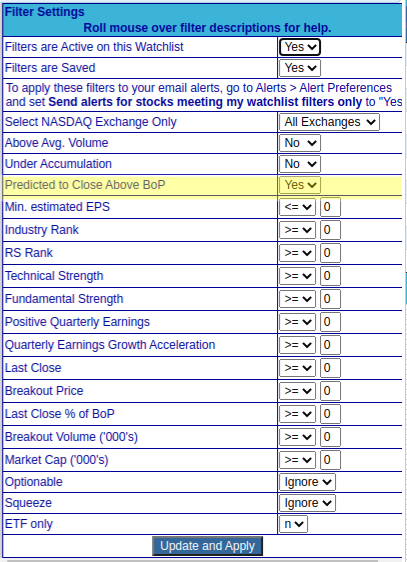 |
|
Our latest strategy
suggestions are here.
|
| List | Breakouts | Avg. Gain |
|---|---|---|
| CWH | 56 | 3.55 |
| SQZ | 234 | 3.01 |
| HTF | 1 | -9.05 |
| HSB | 0 | |
| DB | 14 | 4.37 |
| Due to the large number of Breakouts, only those closing with a gain of 5% or more are included in this list | |||||||||
| Brkout Date | Symbol | Base | Squeeze | Brkout Price | Brkout Day Close | RS Rank* | Last Close | Current % off BOP | Gain at Intraday High |
|---|---|---|---|---|---|---|---|---|---|
| 2021-05-04 | OII | SQZ | y | 11.22 | 11.77 | 91 | 15.4 | 37.25% | 38.59% |
| 2021-05-05 | OII | SQZ | y | 11.78 | 13.91 | 92 | 15.4 | 30.73% | 32% |
| 2021-05-05 | CEIX | SQZ | y | 10.59 | 11.94 | 87 | 13.33 | 25.87% | 29.42% |
| 2021-05-05 | SCX | SQZ | y | 6.30 | 6.37 | 89 | 7.85 | 24.6% | 31.43% |
| 2021-05-06 | LQDT | DB | y | 20.43 | 25.83 | 95 | 24.52 | 20.02% | 27.95% |
| 2021-05-04 | ARNC | CWH | n | 30.10 | 35 | 86 | 35.87 | 19.17% | 22.04% |
| 2021-05-05 | MRC | CWH | n | 9.97 | 11.01 | 83 | 11.67 | 17.05% | 17.05% |
| 2021-05-07 | EMKR | SQZ | y | 6.26 | 7.28 | 82 | 7.28 | 16.29% | 16.61% |
| 2021-05-04 | PTEN | SQZ | y | 7.40 | 7.56 | 88 | 8.56 | 15.68% | 16.28% |
| 2021-05-03 | SCU | SQZ | y | 22.75 | 23.35 | 82 | 26.27 | 15.47% | 16.22% |
| 2021-05-07 | FET | SQZ | y | 18.91 | 21.52 | 88 | 21.52 | 13.8% | 15.55% |
| 2021-05-05 | RVLV | SQZ | y | 51.28 | 52.96 | 97 | 58.15 | 13.4% | 16.85% |
| 2021-05-05 | MUR | SQZ | y | 17.37 | 18.47 | 82 | 19.69 | 13.36% | 13.59% |
| 2021-05-05 | TECK | CWH | n | 22.82 | 24.08 | 88 | 25.65 | 12.4% | 12.4% |
| 2021-05-07 | RVLV | SQZ | y | 51.76 | 58.15 | 97 | 58.15 | 12.35% | 15.77% |
| 2021-05-04 | ACH | CWH | n | 13.65 | 14.2 | 92 | 15.31 | 12.16% | 12.67% |
| 2021-05-06 | SCU | CWH | y | 23.46 | 24.53 | 82 | 26.27 | 11.98% | 12.7% |
| 2021-05-03 | HCCI | CWH | n | 29.49 | 29.93 | 82 | 32.92 | 11.63% | 12.24% |
| 2021-05-04 | TEX | SQZ | y | 49.31 | 50.76 | 93 | 54.66 | 10.85% | 11.01% |
| 2021-05-07 | BKD | SQZ | y | 6.61 | 7.32 | 91 | 7.32 | 10.74% | 11.8% |
| 2021-05-06 | MED | SQZ | y | 252.29 | 267.03 | 86 | 278.32 | 10.32% | 10.58% |
| 2021-05-05 | NOG | CWH | n | 15.16 | 15.84 | 99 | 16.7 | 10.16% | 13.32% |
| 2021-05-05 | FCX | CWH | n | 39.98 | 41.54 | 96 | 43.97 | 9.98% | 11.31% |
| 2021-05-04 | WOW | SQZ | y | 14.46 | 14.79 | 93 | 15.9 | 9.96% | 13.28% |
| 2021-05-07 | PBPB | CWH | y | 6.53 | 7.17 | 84 | 7.17 | 9.8% | 13.32% |
| 2021-05-07 | OPRX | SQZ | y | 47.96 | 52.38 | 95 | 52.38 | 9.22% | 14.68% |
| 2021-05-04 | RFL | SQZ | y | 42.71 | 43.28 | 95 | 46.61 | 9.13% | 12.54% |
| 2021-05-04 | TDW | SQZ | y | 12.85 | 12.9 | 87 | 14 | 8.95% | 8.95% |
| 2021-05-04 | SIM | CWH | n | 14.73 | 15.15 | 88 | 16 | 8.62% | 8.62% |
| 2021-05-05 | CSU | SQZ | y | 44.25 | 46.76 | 98 | 48 | 8.47% | 10.17% |
| 2021-05-05 | TDW | SQZ | y | 12.91 | 13.44 | 88 | 14 | 8.44% | 8.44% |
| 2021-05-07 | NBR | SQZ | y | 91.69 | 99.04 | 98 | 99.04 | 8.02% | 8.94% |
| 2021-05-05 | VRTV | SQZ | y | 44.80 | 47.9 | 98 | 48.37 | 7.97% | 10.29% |
| 2021-05-06 | RFL | SQZ | y | 43.30 | 44.8 | 96 | 46.61 | 7.64% | 11.01% |
| 2021-05-05 | WOW | SQZ | y | 14.80 | 15.42 | 93 | 15.9 | 7.43% | 10.68% |
| 2021-05-07 | CMLS | SQZ | y | 9.96 | 10.7 | 89 | 10.7 | 7.43% | 9.09% |
| 2021-05-03 | OEC | DB | n | 20.40 | 20.68 | 82 | 21.91 | 7.4% | 10.05% |
| 2021-05-03 | HAYN | DB | n | 30.71 | 31.78 | 71 | 32.95 | 7.29% | 7.65% |
| 2021-05-04 | LNC | SQZ | y | 64.63 | 64.68 | 84 | 69.3 | 7.23% | 7.33% |
| 2021-05-07 | CDNA | SQZ | y | 72.69 | 77.71 | 80 | 77.71 | 6.91% | 8.56% |
| 2021-05-07 | KOP | SQZ | y | 35.75 | 38.22 | 81 | 38.22 | 6.91% | 10.32% |
| 2021-05-04 | CMC | SQZ | y | 30.41 | 31.17 | 80 | 32.46 | 6.74% | 7.46% |
| 2021-05-04 | MRO | SQZ | y | 11.14 | 11.32 | 91 | 11.89 | 6.73% | 6.91% |
| 2021-05-03 | ALTM | CWH | n | 61.84 | 67.29 | 98 | 66 | 6.73% | 13.11% |
| 2021-05-06 | KIRK | SQZ | y | 30.12 | 31.65 | 96 | 32.09 | 6.54% | 9.21% |
| 2021-05-05 | R | CWH | n | 81.98 | 85.77 | 88 | 87.22 | 6.39% | 6.62% |
| 2021-05-06 | NLSN | SQZ | y | 26.01 | 26.64 | 82 | 27.65 | 6.31% | 6.38% |
| 2021-05-04 | CNDT | SQZ | y | 7.08 | 7.11 | 94 | 7.52 | 6.21% | 7.34% |
| 2021-05-04 | FWRD | SQZ | y | 94.63 | 97.61 | 80 | 100.48 | 6.18% | 6.28% |
| 2021-05-07 | HCCI | SQZ | y | 31.01 | 32.92 | 87 | 32.92 | 6.16% | 6.74% |
| 2021-05-05 | DCP | SQZ | y | 23.87 | 24.12 | 91 | 25.31 | 6.03% | 8.29% |
| 2021-05-07 | PDCE | CWH | n | 38.76 | 41.08 | 96 | 41.08 | 5.99% | 6.01% |
| 2021-05-05 | OXY | SQZ | y | 25.87 | 27.05 | 85 | 27.39 | 5.88% | 6.46% |
| 2021-05-07 | MGI | CWH | n | 7.59 | 8.03 | 89 | 8.03 | 5.8% | 14.89% |
| 2021-05-07 | OIS | SQZ | y | 6.34 | 6.69 | 80 | 6.69 | 5.52% | 5.84% |
| 2021-05-05 | DVN | CWH | n | 24.85 | 25.23 | 91 | 26.22 | 5.51% | 6.94% |
| 2021-05-06 | UNFI | SQZ | y | 34.78 | 36.36 | 92 | 36.68 | 5.46% | 7.45% |
| 2021-05-05 | GT | CWH | y | 18.66 | 19.23 | 93 | 19.67 | 5.41% | 5.63% |
| 2021-05-04 | BPOP | SQZ | y | 75.10 | 76.04 | 84 | 79.11 | 5.34% | 5.37% |
| 2021-05-04 | FLR | SQZ | y | 23.43 | 23.95 | 87 | 24.68 | 5.34% | 5.68% |
| 2021-05-04 | TBBK | CWH | n | 23.15 | 24.57 | 92 | 24.35 | 5.18% | 8.6% |
| 2021-05-06 | CALX | SQZ | y | 45.69 | 46.33 | 94 | 48 | 5.06% | 6.56% |
| *RS Rank on day before breakout. | |||||||||
| Symbol | Company | Industry | RS Rank | Last Close | BoP | % off BoP |
|---|---|---|---|---|---|---|
| CSU | Capital Senior Living Corporation | Medical Care Facilities | 98 | 48 | 48.75 | 98.46 |
| MCFT | MasterCraft Boat Holdings, Inc. | Recreational Vehicles | 80 | 29.75 | 30.40 | 97.86 |
| CPE | Callon Petroleum Company | Oil & Gas E&P | 99 | 41.12 | 41.98 | 97.95 |
| RUTH | Ruth's Hospitality Group, Inc. | Restaurants | 95 | 27.07 | 27.49 | 98.47 |
| CPLG | CorePoint Lodging Inc. | REIT - Hotel & Motel | 90 | 10.37 | 10.58 | 98.02 |
| CAKE | The Cheesecake Factory Inco | Restaurants | 93 | 63.78 | 65.00 | 98.12 |
| MGY | Magnolia Oil & Gas Corporation Class A | Oil & Gas E&P | 92 | 12.32 | 12.47 | 98.8 |
| SPG | Simon Property Group, Inc. | REIT - Retail | 88 | 124.94 | 125.54 | 99.52 |
| XEC | Cimarex Energy Co | Oil & Gas E&P | 94 | 70.66 | 70.75 | 99.87 |
| ADNT | Adient plc Ordinary Share | Auto Parts | 94 | 49.29 | 50.98 | 96.68 |
| AZUL | Azul S.A. American Deposi | Airlines | 86 | 22.32 | 23.03 | 96.92 |
| CNOB | ConnectOne Bancorp, Inc. | Banks - Regional | 86 | 28.09 | 28.33 | 99.15 |
| ORMP | Oramed Pharmaceuticals Inc. | Biotechnology | 96 | 10.94 | 11.22 | 97.5 |
| PLCE | Children's Place, Inc. | Apparel Retail | 95 | 80.82 | 84.23 | 95.95 |
| VET | Vermilion Energy Inc. | Oil & Gas E&P | 92 | 7.94 | 8.01 | 99.13 |
| GTLS | Chart Industries, Inc. | Specialty Industrial Machinery | 94 | 160.14 | 167.39 | 95.67 |
| FFIC | Flushing Financial Corporation | Banks - Regional | 89 | 24.35 | 24.40 | 99.8 |
| RPT | RPT Realty | REIT - Retail | 91 | 12.98 | 13.15 | 98.71 |
| OFS | OFS Capital Corporation | Asset Management | 88 | 9.37 | 9.44 | 99.26 |
| PGTI | PGT Innovations, Inc. | Building Products & Equipment | 85 | 27.7 | 27.89 | 99.32 |
| TLYS | Tilly's, Inc. | Apparel Retail | 89 | 12.61 | 12.68 | 99.45 |
| TBBK | The Bancorp, Inc. | Banks - Regional | 95 | 24.35 | 25.14 | 96.86 |
| OGCP | Empire State Realty OP, L | REIT - Diversified | 83 | 11.7 | 11.90 | 98.32 |
| CMD | Cantel Medical Corp. | Medical Instruments & Supplies | 85 | 88.18 | 89.76 | 98.24 |
| ANDE | The Andersons, Inc. | Food Distribution | 86 | 30.86 | 31.21 | 98.88 |
| GWB | Great Western Bancorp, Inc. | Banks - Regional | 93 | 34.47 | 34.55 | 99.77 |
| CNTY | Century Casinos, Inc. | Resorts & Casinos | 95 | 12.67 | 13.57 | 93.37 |
| CLFD | Clearfield, Inc. | Communication Equipment | 89 | 39.09 | 40.26 | 97.09 |
| AIV | Apartment Investment and Management Company | REIT - Residential | 92 | 6.97 | 7.09 | 98.31 |
| SXC | SunCoke Energy, Inc. | Coking Coal | 93 | 7.66 | 7.81 | 98.08 |
| VRTS | Virtus Investment Partners, Inc. | Asset Management | 89 | 275.58 | 281.99 | 97.73 |
| DDS | Dillard's, Inc. | Department Stores | 96 | 106.23 | 112.38 | 94.53 |
| PPBI | Pacific Premier Bancorp Inc | Banks - Regional | 89 | 46.4 | 46.66 | 99.44 |
| ESRT | Empire State Realty Trust, Inc. | REIT - Diversified | 81 | 11.8 | 12.06 | 97.84 |
| UVSP | Univest Financial Corporation | Banks - Regional | 82 | 29.38 | 29.49 | 99.63 |
| JAX | J. Alexander's Holdings, Inc. | Restaurants | 91 | 10.82 | 11.00 | 98.36 |
| EAF | GrafTech International Ltd. | Specialty Industrial Machinery | 84 | 13.29 | 13.50 | 98.44 |
| OKE | ONEOK, Inc. | Oil & Gas Midstream | 83 | 53.38 | 53.96 | 98.93 |
| FRBA | First Bank | Banks - Regional | 83 | 13.36 | 13.83 | 96.6 |
| CLNY | Colony Capital, Inc. | REIT - Diversified | 94 | 7 | 7.22 | 96.95 |
| OBNK | Origin Bancorp, Inc. | Banks - Regional | 88 | 44.76 | 45.01 | 99.44 |
| HT | Hersha Hospitality Trust Class A | REIT - Hotel & Motel | 91 | 11.63 | 12.18 | 95.48 |
| GBX | Greenbrier Companies, Inc. | Railroads | 90 | 49.1 | 50.08 | 98.04 |
| KRUS | Kura Sushi USA, Inc. | Restaurants | 94 | 35.68 | 38.98 | 91.53 |
| HOFT | Hooker Furniture Corporation | Furnishings, Fixtures & Appliances | 86 | 39.2 | 39.84 | 98.39 |
| FANG | Diamondback Energy, Inc. | Oil & Gas E&P | 93 | 84.21 | 87.60 | 96.13 |
| FISI | Financial Institutions, Inc. | Banks - Regional | 86 | 32.6 | 32.95 | 98.94 |
| XPEL | XPEL, Inc. | Auto Parts | 96 | 62.99 | 68.73 | 91.65 |
| SZC | Cushing NextGen Infrastructure Inco | Asset Management | 95 | 43.9 | 45.79 | 95.87 |
| SUM | Summit Materials, Inc. | Building Materials | 87 | 30.95 | 31.82 | 97.27 |
| HTBI | HomeTrust Bancshares, Inc. | Banks - Regional | 83 | 27.43 | 27.84 | 98.53 |
| OMF | OneMain Holdings, Inc. | Credit Services | 85 | 56.97 | 58.12 | 98.02 |
| USFD | US Foods Holding Corp. | Food Distribution | 82 | 40.57 | 42.10 | 96.37 |
| *These stocks were selected using our price breakout model. This model correctly selected CWH stocks that met or exceeded their breakout price with 80% probability over Jan. 2019 to Nov. 2020. This does not imply that on any one day, 80% or any of the stocks selected will meet or exceed their breakout price. | ||||||
| Symbol | BO Price |
BO Vol. |
Company | Industry | RS Rank |
Last Close |
|---|---|---|---|---|---|---|
| RENN | 11.11 | 2,147,483,647 | Renren Inc. | Auto & Truck Dealerships | 98 | 9.63 |
| HYRE | 13.98 | 692,444 | HyreCar Inc. | Rental & Leasing Services | 98 | 12.99 |
| ORMP | 11.22 | 1,007,276 | Oramed Pharmaceuticals Inc. | Biotechnology | 96 | 10.94 |
| SKT | 18.82 | 291,244,946 | Tanger Factory Outlet Centers - Inc. | REIT - Retail | 94 | 17.59 |
| BHR | 7.25 | 1,130,082 | Braemar Hotels & Resorts Inc. | REIT - Hotel & Motel | 94 | 6.78 |
| CLNY | 7.22 | 4,582,278 | Colony Capital - Inc. | REIT - Diversified | 94 | 7.00 |
| SXC | 7.81 | 414,610,934 | SunCoke Energy - Inc. | Coking Coal | 93 | 7.66 |
| MGY | 12.47 | 3,165,950 | Magnolia Oil & Gas Corporation Class A | Oil & Gas E&P | 92 | 12.32 |
| AIV | 7.09 | 5,585,391 | Apartment Investment and Management Company | REIT - Residential | 92 | 6.97 |
| UMC | 11.25 | 294,315,016 | United Microelectronics Corporation (NEW) | Semiconductors | 92 | 9.65 |
| These stocks meet our suggested screening factors
for our Cup and Handle Chart Pattern watchlist. See Revised Rules for Trading Cup and Handle Breakouts |
||||||
| Index | Value | Change Week | Change YTD | Trend1 |
|---|---|---|---|---|
| Dow | 34777.8 |
2.67% | 13.63% | Up |
| NASDAQ | 13752.2 |
-1.51% | 6.7% | Up |
| S&P 500 | 4232.6 |
1.23% | 12.69% | Up |
|
1The Market Trend is derived from
our proprietary market model. The market model is described on
the site here.
2The site also shows industry rankings based on fundamentals, combined technical and fundamentals, and on price alone. The site also shows daily industry movements. |
||||
| 1 Week | 13 Weeks | 26 Weeks | Year-to-Date |
|---|---|---|---|
| Dow Jones |
Dow Jones 11.65 |
Dow Jones 22.79 |
Dow Jones 13.63 |
| 1 Week | 3 Weeks | 13 Weeks | 26 Weeks |
|---|---|---|---|
| Aluminum |
Aluminum |
Solar |
Financial Data & Stock Exchanges |
| Thermal Coal 69 |
Thermal Coal 52 |
REIT - Residential 89 |
Thermal Coal 138 |
| Charts of each industry rank and performance over 12 months are available on the site | |||
If you received this newsletter from a friend and you would like to receive it regularly please go to the BreakoutWatch.com site and you will then be able to register to receive the newsletter.
Copyright (c) 05/08/2021 NBIcharts, LLC dba BreakoutWatch.com. All
rights reserved.
" BreakoutWatch," the BreakoutWatch.com "eye" logo, and the slogan
"tomorrow's breakouts today" are service marks of NBIcharts LLC. All
other marks are the property of their respective owners, and are used
for descriptive purposes only.
BreakoutWatch is not affiliated with Investor's Business Daily or with Mr. William O'Neil. Our site, research and analysis is supported entirely by subscription and is free from advertising.