Breakoutwatch Weekly Summary 06/12/21
You are receiving this email because you are or were a
BreakoutWatch.com subscriber, or have subscribed to our weekly
newsletter. This newsletter summarizes the breakout events of the week
and provides additional guidance that does not fit into our daily
format. It is published each weekend.
Newsletter Archive: https://www.breakoutwatch.com/content/newsletters
| NASDAQ Back in Favor as
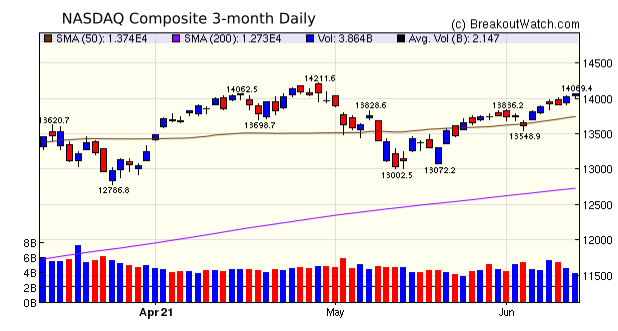
Inflationary Fears Subside The NASDAQ gained 1.9% this week while the DJI slipped 0.8% and the S&P 500 added just 0.4% but did set a new all-time high on Thursday. The NASDAQ performance was helped by Amazon (AMZN) which gained 4%. Amazon is the third highest weighted stock, representing 8.5% of the index, after Apple and Microsoft. After concerns a month ago about inflation and rising Treasury rates, the market seems to have accepted that any inflationary effects will be short lived while supply chain issues are resolved. Evidence for this is that the market took the 0.6% increase month-on-month, and 5% increase year-on-year in its stride. Notably the 10-yr yield fell ten basis points to 1.46%  Volatility Squeeze pattern stocks
(SQZ) continue to outperform cup and handle patterns scoring the
top 4 positions out of 107 breakouts this week. As a reminder,
we no longer require volume to be 150% of 50 day ADV before
classifying a stock as a breakout. See
Is Breakout Day Volume Significant for Medium Term Success?
|
In view of the
out-performance of Volatility Squeeze patterns currently, I've
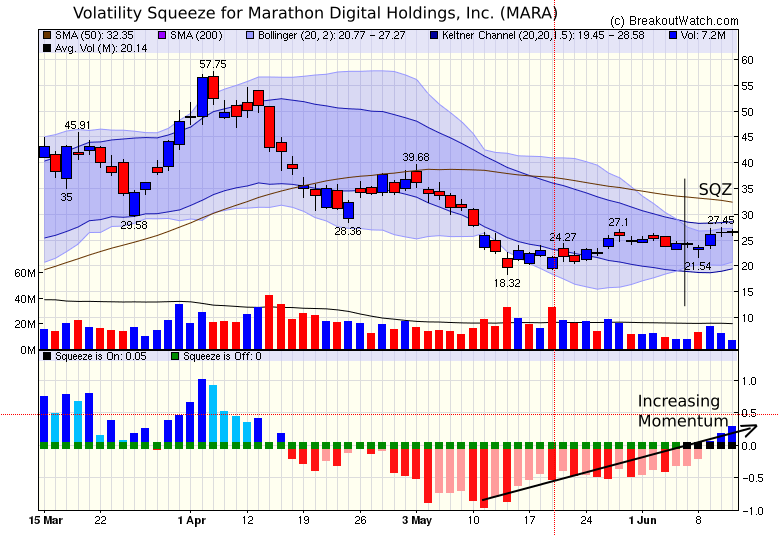
selected Marathon Digital Holdings, Inc. (MARA) as this
week's Chart of the Week. MARA has been in a SQZ pattern for 5
days and is showing a strong acceleration in momentum. Two
successive hanging Doji's on Thursday and Friday show some
hesitation in the direction of the next move, but should this
breakout there is plenty of room to move higher before reaching
resistance at 39.7 Although not showing a strong technical
score, MARA has a fundamental score of 8.5 out of 11. |
| No new features this week |
|
Our latest strategy
suggestions are here.
|
| List | Breakouts | Avg. Gain |
|---|---|---|
| CWH | 20 | 2.94 |
| SQZ | 83 | 2.18 |
| HTF | 0 | |
| HSB | 0 | |
| DB | 4 | -1.66 |
| Brkout Date | Symbol | Base | Squeeze | Brkout Price | Brkout Day Close | RS Rank* | Last Close | Current % off BOP | Gain at Intraday High |
|---|---|---|---|---|---|---|---|---|---|
| 2021-06-08 | JAN | SQZ | y | 7.23 | 8 | 80 | 8.93 | 23.51% | 25.45% |
| 2021-06-09 | BKD | SQZ | y | 6.89 | 7.3 | 88 | 8.49 | 23.22% | 23.51% |
| 2021-06-07 | NTLA | SQZ | y | 72.25 | 77.66 | 97 | 85.29 | 18.05% | 19.11% |
| 2021-06-07 | CLNE | SQZ | y | 9.32 | 10.36 | 95 | 10.8 | 15.88% | 55.58% |
| 2021-06-07 | ORMP | CWH | n | 12.30 | 13.6 | 98 | 14.17 | 15.2% | 23.33% |
| 2021-06-09 | FATE | SQZ | y | 79.24 | 82.87 | 89 | 89.75 | 13.26% | 14.82% |
| 2021-06-11 | JAN | SQZ | y | 8.13 | 8.93 | 86 | 8.93 | 9.84% | 11.56% |
| 2021-06-09 | QFIN | CWH | n | 36.79 | 39.21 | 97 | 40.35 | 9.68% | 13.73% |
| 2021-06-07 | CDNA | CWH | n | 83.53 | 87.39 | 89 | 91.25 | 9.24% | 12.19% |
| 2021-06-08 | CLDX | SQZ | y | 28.51 | 29.65 | 98 | 31.04 | 8.87% | 8.94% |
| 2021-06-09 | ARLP | SQZ | y | 6.56 | 7.2 | 80 | 7.13 | 8.69% | 12.8% |
| 2021-06-08 | SPT | CWH | n | 72.00 | 76.94 | 85 | 78.03 | 8.38% | 10.04% |
| 2021-06-10 | FATE | SQZ | y | 82.88 | 88.42 | 88 | 89.75 | 8.29% | 9.77% |
| 2021-06-08 | SE | SQZ | y | 256.83 | 264.1 | 89 | 277.69 | 8.12% | 8.45% |
| 2021-06-07 | ANGO | SQZ | y | 23.34 | 24.01 | 88 | 25.23 | 8.1% | 10.33% |
| 2021-06-08 | HEAR | CWH | n | 34.50 | 35.68 | 93 | 37.22 | 7.88% | 9.25% |
| 2021-06-08 | FLWS | SQZ | y | 35.33 | 37.84 | 80 | 37.97 | 7.47% | 8.94% |
| 2021-06-08 | SOHOO | CWH | n | 20.00 | 20.5 | 90 | 21.31 | 6.55% | 7.5% |
| 2021-06-07 | NTRA | SQZ | y | 97.52 | 102.17 | 87 | 103.88 | 6.52% | 9.78% |
| 2021-06-08 | KODK | SQZ | y | 8.68 | 11.05 | 85 | 9.24 | 6.45% | 29.72% |
| 2021-06-08 | GNRC | SQZ | y | 329.97 | 350.8 | 90 | 349.18 | 5.82% | 7.56% |
| 2021-06-08 | GRTS | SQZ | y | 9.55 | 10.05 | 93 | 10.07 | 5.45% | 8.48% |
| 2021-06-08 | ZDGE | SQZ | y | 14.45 | 15.08 | 99 | 15.23 | 5.4% | 14.19% |
| 2021-06-08 | SIEN | SQZ | y | 7.07 | 7.37 | 80 | 7.44 | 5.23% | 8.35% |
| 2021-06-09 | UUU | SQZ | y | 7.12 | 7.52 | 98 | 7.49 | 5.2% | 11.24% |
| 2021-06-08 | SOHOB | CWH | n | 20.43 | 21.45 | 91 | 21.48 | 5.14% | 6.46% |
| 2021-06-08 | ANGO | SQZ | y | 24.02 | 25.04 | 90 | 25.23 | 5.04% | 7.2% |
| *RS Rank on day before breakout. | |||||||||
| Symbol | Company | Industry | RS Rank | Last Close | BoP | % off BoP |
|---|---|---|---|---|---|---|
| FOSL | Fossil Group, Inc. | Luxury Goods | 91 | 15.62 | 16.08 | 97.14 |
| AVXL | Anavex Life Sciences Corp. | Biotechnology | 97 | 15.5 | 15.99 | 96.94 |
| UUU | Universal Security Instruments, Inc. | Security & Protection Services | 99 | 7.49 | 7.92 | 94.57 |
| NVAX | Novavax, Inc. | Biotechnology | 95 | 209.68 | 214.50 | 97.75 |
| PBI | Pitney Bowes Inc. | Business Equipment & Supplies | 91 | 9.17 | 9.35 | 98.07 |
| MIC | Macquarie Infrastructure Corporation | Airports & Air Services | 86 | 38.94 | 39.14 | 99.49 |
| NBR | Nabors Industries Ltd. | Oil & Gas Drilling | 93 | 117.33 | 121.62 | 96.47 |
| BNED | Barnes & Noble Education, Inc | Specialty Retail | 97 | 9.52 | 9.73 | 97.84 |
| AVNW | Aviat Networks, Inc. | Communication Equipment | 97 | 38.87 | 39.25 | 99.03 |
| HZN | Horizon Global Corporation | Auto Parts | 92 | 9.91 | 10.14 | 97.73 |
| *These stocks were selected using our price breakout model. This model correctly selected CWH stocks that met or exceeded their breakout price with 80% probability over Jan. 2019 to Nov. 2020. This does not imply that on any one day, 80% or any of the stocks selected will meet or exceed their breakout price. | ||||||
| Symbol | BO Price |
BO Vol. |
Company | Industry | RS Rank |
Last Close |
|---|---|---|---|---|---|---|
| UUU | 7.92 | 285,758,318 | Universal Security Instruments - Inc. | Security & Protection Services | 99 | 7.49 |
| SUNW | 11.18 | 4,357,082 | Sunworks - Inc. | Solar | 99 | 9.91 |
| STIM | 17.05 | 618,231 | Neuronetics - Inc. | Diagnostics & Research | 98 | 15.63 |
| RENN | 12.30 | 2,147,483,647 | Renren Inc. | Auto & Truck Dealerships | 97 | 11.29 |
| SLS | 13.35 | 674,476 | SELLAS Life Sciences Group - Inc. | Biotechnology | 97 | 11.43 |
| AVXL | 15.99 | 1,387,076 | Anavex Life Sciences Corp. | Biotechnology | 97 | 15.50 |
| BNED | 9.73 | 822,638 | Barnes & Noble Education - Inc | Specialty Retail | 97 | 9.52 |
| HIMX | 14.59 | 6,258,562 | Himax Technologies - Inc. | Semiconductors | 97 | 14.24 |
| CLNE | 14.50 | 19,204,572 | Clean Energy Fuels Corp. | Oil & Gas Refining & Marketing | 97 | 10.80 |
| BW | 9.42 | 1,617,348 | Babcock & Wilcox Enterprises - Inc. | Specialty Industrial Machinery | 96 | 8.50 |
| These stocks meet our suggested screening factors
for our Cup and Handle Chart Pattern watchlist. See Revised Rules for Trading Cup and Handle Breakouts |
||||||
| Index | Value | Change Week | Change YTD | Trend1 |
|---|---|---|---|---|
| Dow | 34479.6 |
-0.8% | 12.65% | Up |
| NASDAQ | 14069.4 |
1.85% | 9.16% | Up |
| S&P 500 | 4247.44 |
0.41% | 13.08% | Up |
|
1The Market Trend is derived from
our proprietary market model. The market model is described on
the site here.
2The site also shows industry rankings based on fundamentals, combined technical and fundamentals, and on price alone. The site also shows daily industry movements. |
||||
| 1 Week | 13 Weeks | 26 Weeks | Year-to-Date |
|---|---|---|---|
| NASDAQ Composite |
S&P 500 7.71 |
S&P 500 15.94 |
S&P 500 13.08 |
| 1 Week | 3 Weeks | 13 Weeks | 26 Weeks |
|---|---|---|---|
| Industrial Distribution |
Aluminum |
Aluminum |
Medical Distribution |
| Luxury Goods 49 |
Oil & Gas Equipment & Services 68 |
Confectioners 122 |
Thermal Coal 144 |
| Charts of each industry rank and performance over 12 months are available on the site | |||
If you received this newsletter from a friend and you would like to receive it regularly please go to the BreakoutWatch.com site and you will then be able to register to receive the newsletter.
Copyright (c) 06/12/2021 NBIcharts, LLC dba BreakoutWatch.com. All
rights reserved.
" BreakoutWatch," the BreakoutWatch.com "eye" logo, and the slogan
"tomorrow's breakouts today" are service marks of NBIcharts LLC. All
other marks are the property of their respective owners, and are used
for descriptive purposes only.
BreakoutWatch is not affiliated with Investor's Business Daily or with Mr. William O'Neil. Our site, research and analysis is supported entirely by subscription and is free from advertising.