Breakoutwatch Weekly Summary 06/18/21
You are receiving this email because you are or were a
BreakoutWatch.com subscriber, or have subscribed to our weekly
newsletter. This newsletter summarizes the breakout events of the week
and provides additional guidance that does not fit into our daily
format. It is published each weekend.
Newsletter Archive: https://www.breakoutwatch.com/content/newsletters
| Markets Fear that Effects of
Reopening May have Peaked The week began well with the S&P 500 and NASDAQ setting new highs but a change in stance by the Fed re when an increase in interest rates is likely, took some life away from the party. The Fed now expects 2 interest rate increases by the end of 2023 whereas previous indications were that there would be no increases in 2023. The markets concluded that inflationary pressures are rising and that growth rates may have reached their peak. There was an immediate negative effect on the NASDAQ as Fed Chairman Powell spoke on Wednesday, optimistic bulls were in control on Thursday but pragmatic realists took the index lower on Friday to close 0.3% down. When one considers that the NASDAQ has risen 44% since February 2020 one has to ask "How is that sustainable when the economy now is anemic compared to the full employment economy of February 2020?". Take note that our market trend signal for the DJI turned negative on Thursday. I expect the other two will follow suite shortly. 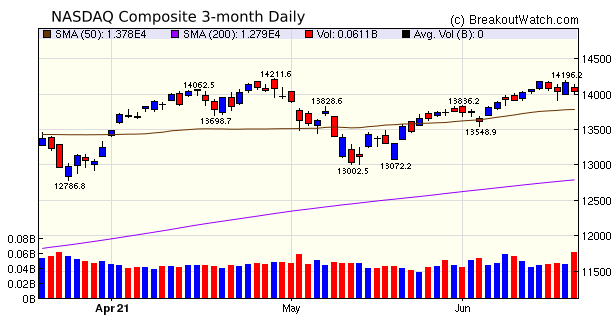 |
Clean Energy Fuels
set a pivot on June 9 on massive relative volume. Since then the
swing traders have taken profits and now seem likely to want to
buy back in. Friday's volume was again massive relative to the
50 day average although bulls and bears were in a tussle as the
candlestick shows, with the bulls winning out.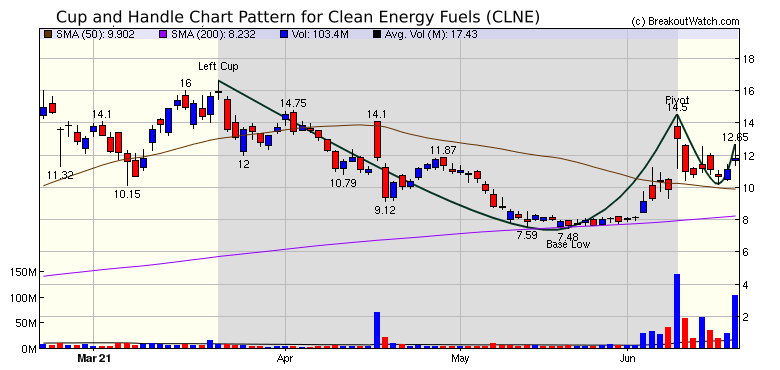 |
| No new features this week |
|
Our latest strategy
suggestions are here.
|
| List | Breakouts | Avg. Gain |
|---|---|---|
| CWH | 27 | 2.04 |
| SQZ | 49 | -0.52 |
| HTF | 0 | |
| HSB | 0 | |
| DB | 0 |
| Brkout Date | Symbol | Base | Squeeze | Brkout Price | Brkout Day Close | RS Rank* | Last Close | Current % off BOP | Gain at Intraday High |
|---|---|---|---|---|---|---|---|---|---|
| 2021-06-14 | AVXL | CWH | n | 15.99 | 20.99 | 97 | 22.14 | 38.46% | 40.28% |
| 2021-06-14 | MSTR | SQZ | y | 516.45 | 598.49 | 96 | 646.46 | 25.17% | 25.39% |
| 2021-06-14 | APEN | CWH | n | 7.92 | 8.75 | 97 | 8.8 | 11.11% | 13.76% |
| 2021-06-14 | HSKA | CWH | y | 210.26 | 218.72 | 89 | 230.86 | 9.8% | 10.13% |
| 2021-06-17 | ENPH | SQZ | y | 152.03 | 161.99 | 87 | 165.85 | 9.09% | 10.58% |
| 2021-06-15 | GTYH | SQZ | y | 6.68 | 6.99 | 83 | 7.28 | 8.98% | 15.87% |
| 2021-06-14 | MARA | SQZ | y | 26.56 | 29.94 | 99 | 28.92 | 8.89% | 20.71% |
| 2021-06-14 | GNRC | CWH | n | 354.93 | 355.09 | 91 | 386.4 | 8.87% | 10.34% |
| 2021-06-14 | EVLO | CWH | n | 15.13 | 16.34 | 96 | 16.45 | 8.72% | 12.36% |
| 2021-06-15 | MSTR | SQZ | y | 598.50 | 630.54 | 97 | 646.46 | 8.01% | 8.2% |
| 2021-06-14 | DOMO | CWH | n | 72.50 | 72.77 | 87 | 78.17 | 7.82% | 9.35% |
| 2021-06-17 | DMTK | SQZ | y | 41.27 | 43.44 | 96 | 44.41 | 7.61% | 8.38% |
| 2021-06-14 | WK | CWH | n | 100.78 | 103.62 | 83 | 107.52 | 6.69% | 7.3% |
| 2021-06-15 | HSKA | SQZ | y | 218.73 | 221.85 | 90 | 230.86 | 5.55% | 5.87% |
| *RS Rank on day before breakout. | |||||||||
| Symbol | Company | Industry | RS Rank | Last Close | BoP | % off BoP |
|---|---|---|---|---|---|---|
| UUU | Universal Security Instruments, Inc. | Security & Protection Services | 99 | 7.81 | 8.00 | 97.63 |
| ALLT | Allot Ltd. | Communication Equipment | 91 | 20.22 | 21.04 | 96.1 |
| PACB | Pacific Biosciences of California, Inc. | Diagnostics & Research | 98 | 29.15 | 30.31 | 96.17 |
| PRT | PermRock Royalty Trust Tr | Oil & Gas Equipment & Services | 96 | 7.08 | 7.09 | 99.86 |
| STIM | Neuronetics, Inc. | Diagnostics & Research | 98 | 16.85 | 17.56 | 95.96 |
| USIO | Usio, Inc. | Software - Infrastructure | 96 | 6.5 | 6.85 | 94.89 |
| ANGO | AngioDynamics, Inc. | Medical Instruments & Supplies | 94 | 25.47 | 25.75 | 98.91 |
| IESC | IES Holdings, Inc. | Engineering & Construction | 85 | 53.39 | 55.93 | 95.46 |
| FPH | Five Point Holdings, LLC Class A | Real Estate - Development | 80 | 8.04 | 8.39 | 95.83 |
| CLNE | Clean Energy Fuels Corp. | Oil & Gas Refining & Marketing | 98 | 11.78 | 14.50 | 81.24 |
| SYNA | Synaptics Inco | Semiconductors | 89 | 145.76 | 148.00 | 98.49 |
| MRLN | Marlin Business Services Corp. | Credit Services | 96 | 22.87 | 23.20 | 98.58 |
| CVEO | Civeo Corporation (Canada) | Specialty Business Services | 87 | 17.8 | 18.48 | 96.32 |
| BLNK | Blink Charging Co. | Specialty Retail | 99 | 39.28 | 43.00 | 91.35 |
| SNAP | Snap Inc. | Internet Content & Information | 93 | 63.17 | 65.66 | 96.21 |
| GOOGL | Alphabet Inc. | Internet Content & Information | 83 | 2402.22 | 2455.51 | 97.83 |
| BE | Bloom Energy Corporation Class A | Electrical Equipment & Parts | 82 | 24.65 | 26.98 | 91.36 |
| QTRX | Quanterix Corporation | Biotechnology | 89 | 64.44 | 69.09 | 93.27 |
| MIC | Macquarie Infrastructure Corporation | Airports & Air Services | 87 | 38.71 | 39.25 | 98.62 |
| USCR | U S Concrete, Inc. | Building Materials | 94 | 73.9 | 75.47 | 97.92 |
| ASPN | Aspen Aerogels, Inc. | Building Products & Equipment | 94 | 23.82 | 24.93 | 95.55 |
| FUTU | Futu Holdings Limited | Capital Markets | 99 | 154.34 | 163.78 | 94.24 |
| PRTS | CarParts.com, Inc. | Internet Retail | 87 | 18.29 | 19.25 | 95.01 |
| COHR | Coherent, Inc. | Scientific & Technical Instruments | 90 | 262.13 | 269.98 | 97.09 |
| MRNS | Marinus Pharmaceuticals, Inc. | Biotechnology | 80 | 18.5 | 19.59 | 94.44 |
| RHP | Ryman Hospitality Properties, Inc. | REIT - Hotel & Motel | 88 | 81.8 | 84.58 | 96.71 |
| DNLI | Denali Therapeutics Inc. | Biotechnology | 90 | 73.73 | 76.92 | 95.85 |
| NTRA | Natera, Inc. | Diagnostics & Research | 82 | 102.88 | 107.06 | 96.1 |
| *These stocks were selected using our price breakout model. This model correctly selected CWH stocks that met or exceeded their breakout price with 80% probability over Jan. 2019 to Nov. 2020. This does not imply that on any one day, 80% or any of the stocks selected will meet or exceed their breakout price. | ||||||
| Symbol | BO Price |
BO Vol. |
Company | Industry | RS Rank |
Last Close |
|---|---|---|---|---|---|---|
| UUU | 8.00 | 285,740,031 | Universal Security Instruments - Inc. | Security & Protection Services | 99 | 7.81 |
| STIM | 17.56 | 624,110 | Neuronetics - Inc. | Diagnostics & Research | 98 | 16.85 |
| CLNE | 14.50 | 26,141,266 | Clean Energy Fuels Corp. | Oil & Gas Refining & Marketing | 98 | 11.78 |
| SLS | 13.35 | 612,730 | SELLAS Life Sciences Group - Inc. | Biotechnology | 97 | 11.39 |
| HIMX | 15.98 | 6,580,808 | Himax Technologies - Inc. | Semiconductors | 97 | 14.00 |
| MGI | 11.85 | 3,883,806 | Moneygram International - Inc. | Credit Services | 96 | 10.24 |
| PRT | 7.09 | 319,180,454 | PermRock Royalty Trust Tr | Oil & Gas Equipment & Services | 96 | 7.08 |
| UUUU | 7.35 | 325,151,224 | Energy Fuels Inc | Uranium | 96 | 6.23 |
| RENN | 12.30 | 2,147,483,647 | Renren Inc. | Auto & Truck Dealerships | 96 | 11.39 |
| BW | 9.42 | 1,556,409 | Babcock & Wilcox Enterprises - Inc. | Specialty Industrial Machinery | 95 | 7.50 |
| These stocks meet our suggested screening factors
for our Cup and Handle Chart Pattern watchlist. See Revised Rules for Trading Cup and Handle Breakouts |
||||||
| Index | Value | Change Week | Change YTD | Trend1 |
|---|---|---|---|---|
| Dow | 33290.1 |
-3.45% | 8.77% | Down |
| NASDAQ | 14030.4 |
-0.28% | 8.86% | Up |
| S&P 500 | 4166.45 |
-1.91% | 10.93% | Up |
|
1The Market Trend is derived from
our proprietary market model. The market model is described on
the site here.
2The site also shows industry rankings based on fundamentals, combined technical and fundamentals, and on price alone. The site also shows daily industry movements. |
||||
| 1 Week | 13 Weeks | 26 Weeks | Year-to-Date |
|---|---|---|---|
| NASDAQ Composite |
S&P 500 6.47 |
S&P 500 12.32 |
S&P 500 10.93 |
| 1 Week | 3 Weeks | 13 Weeks | 26 Weeks |
|---|---|---|---|
| Thermal Coal |
Rental & Leasing Services |
Uranium |
REIT - Industrial |
| Uranium 145 |
Uranium 145 |
REIT - Specialty 105 |
Thermal Coal 146 |
| Charts of each industry rank and performance over 12 months are available on the site | |||
If you received this newsletter from a friend and you would like to receive it regularly please go to the BreakoutWatch.com site and you will then be able to register to receive the newsletter.
Copyright (c) 06/18/2021 Proactive Technologies, LLC dba
BreakoutWatch.com. All rights reserved.
" BreakoutWatch," the BreakoutWatch.com "eye" logo, and the slogan
"tomorrow's breakouts today" are service marks of Proactive Technologies
LLC. All other marks are the property of their respective owners, and
are used for descriptive purposes only.
BreakoutWatch is not affiliated with Investor's Business Daily or with Mr. William O'Neil. Our site, research and analysis is supported entirely by subscription and is free from advertising.