Breakoutwatch Weekly Summary 10/16/21
You are receiving this email because you are or were a
BreakoutWatch.com subscriber, or have subscribed to our weekly
newsletter. This newsletter summarizes the breakout events of the week
and provides additional guidance that does not fit into our daily
format. It is published each weekend.
Newsletter Archive: https://www.breakoutwatch.com/content/newsletters
| NASDAQ Gains 2.2% on Earnings,
Retail sales, Inflation News Earning season kicked off with mostly better than expected earnings, particularly by banks. Retail sales increased 0.7% month-on-month and the 10-year Treasury yield decreased by 3 basis points implying peak inflation may be here. The result was a 2.2% gain for the NASDAQ with the S&P 500 lagging at 1.8% and the DJI at 1.6%. The NASDAQ closed above its 50 day moving average on Friday for the first time since September 27 but Friday's hanging doji candlestick shows uncertainty that the next move will be upwards. 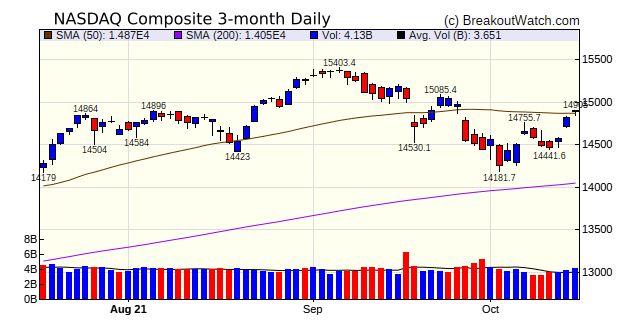 |
Genesis Energy
(GEL) may not breakout on Monday but the stock is one to watch
in the coming days due to the nicely shaped cup and ascending
right side handle. GEL is in the Oil and Gas Midstream industry
group which has an industry rank of 10, putting it very on the
list of strong industries.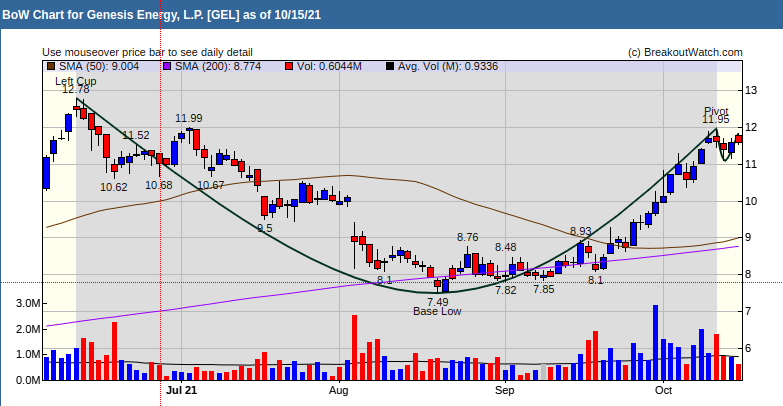 |
| No new features this week |
|
Our latest strategy
suggestions are here.
|
| List | Breakouts | Avg. Gain |
|---|---|---|
| CWH | 15 | 1.85 |
| SQZ | 31 | -0.24 |
| HTF | 0 | |
| HSB | 0 | |
| DB | 0 |
| Brkout Date | Symbol | Base | Squeeze | Brkout Price | Brkout Day Close | RS Rank* | Last Close | Current % off BOP | Gain at Intraday High |
|---|---|---|---|---|---|---|---|---|---|
| 2021-10-12 | ALOT | SQZ | y | 15.95 | 15.96 | 90 | 17.08 | 7.08% | 7.91% |
| 2021-10-13 | ALOT | SQZ | y | 15.97 | 16.36 | 90 | 17.08 | 6.95% | 7.77% |
| *RS Rank on day before breakout. | |||||||||
| Symbol | Company | Industry | RS Rank | Last Close | BoP | % off BoP |
|---|---|---|---|---|---|---|
| PUYI | Puyi Inc. | Asset Management | 83 | 6 | 6.12 | 98.04 |
| HAYN | Haynes International, Inc. | Metal Fabrication | 89 | 39.58 | 40.63 | 97.42 |
| CNSL | Consolidated Communications Holdings, Inc. | Telecom Services | 93 | 9.46 | 9.70 | 97.53 |
| FFIC | Flushing Financial Corporation | Banks - Regional | 89 | 23.21 | 23.81 | 97.48 |
| TSQ | Townsquare Media, Inc. | Advertising Agencies | 91 | 13.48 | 13.75 | 98.04 |
| TRIL | Trillium Therapeutics Inc. | Biotechnology | 97 | 17.5 | 17.91 | 97.71 |
| CSTR | CapStar Financial Holdings, Inc. | Banks - Regional | 92 | 21.82 | 22.00 | 99.18 |
| GEL | Genesis Energy, L.P. | Oil & Gas Midstream | 89 | 11.58 | 11.95 | 96.9 |
| BHF | Brighthouse Financial, Inc. | Insurance - Life | 84 | 49.35 | 50.96 | 96.84 |
| SVBI | Severn Bancorp Inc | Banks - Regional | 84 | 12.9 | 13.12 | 98.32 |
| GLNG | Golar LNG Limited | Oil & Gas Midstream | 82 | 13.54 | 14.36 | 94.29 |
| *These stocks were selected using our price breakout model. This model correctly selected CWH stocks that met or exceeded their breakout price with 80% probability over Jan. 2019 to Nov. 2020. This does not imply that on any one day, 80% or any of the stocks selected will meet or exceed their breakout price. | ||||||
| Symbol | BO Price |
BO Vol. |
Company | Industry | RS Rank |
Last Close |
|---|---|---|---|---|---|---|
| TRIL | 17.91 | 5,063,840 | Trillium Therapeutics Inc. | Biotechnology | 97 | 17.50 |
| CNSL | 9.70 | 501,909 | Consolidated Communications Holdings - Inc. | Telecom Services | 93 | 9.46 |
| GEL | 11.95 | 1,400,339 | Genesis Energy - L.P. | Oil & Gas Midstream | 89 | 11.58 |
| GLNG | 14.36 | 1,472,927 | Golar LNG Limited | Oil & Gas Midstream | 82 | 13.54 |
| FCF | 14.47 | 569,569 | First | Banks - Regional | 80 | 14.09 |
| These stocks meet our suggested screening factors
for our Cup and Handle Chart Pattern watchlist. See Revised Rules for Trading Cup and Handle Breakouts |
||||||
| Index | Value | Change Week | Change YTD | Trend1 |
|---|---|---|---|---|
| Dow | 35294.8 |
1.58% | 15.32% | Down |
| NASDAQ | 14897.3 |
2.18% | 15.59% | Down |
| S&P 500 | 4471.37 |
1.82% | 19.05% | Down |
|
1The Market Trend is derived from
our proprietary market model. The market model is described on
the site here.
2The site also shows industry rankings based on fundamentals, combined technical and fundamentals, and on price alone. The site also shows daily industry movements. |
||||
| 1 Week | 13 Weeks | 26 Weeks | Year-to-Date |
|---|---|---|---|
| NASDAQ Composite |
S&P 500 3.34 |
S&P 500 6.84 |
S&P 500 19.05 |
| 1 Week | 3 Weeks | 13 Weeks | 26 Weeks |
|---|---|---|---|
| Thermal Coal |
Uranium |
Luxury Goods |
Grocery Stores |
| Aerospace & Defense 0 |
Aerospace & Defense 0 |
Aerospace & Defense 0 |
Aerospace & Defense 0 |
| Charts of each industry rank and performance over 12 months are available on the site | |||
If you received this newsletter from a friend and you would like to receive it regularly please go to the BreakoutWatch.com site and you will then be able to register to receive the newsletter.
Copyright (c) 10/16/2021 Proactive Technologies, LLC dba
BreakoutWatch.com. All rights reserved.
" BreakoutWatch," the BreakoutWatch.com "eye" logo, and the slogan
"tomorrow's breakouts today" are service marks of Proactive Technologies
LLC. All other marks are the property of their respective owners, and
are used for descriptive purposes only.
BreakoutWatch is not affiliated with Investor's Business Daily or with Mr. William O'Neil. Our site, research and analysis is supported entirely by subscription and is free from advertising.