Breakoutwatch Weekly Summary 11/13/21
You are receiving this email because you are or were a
BreakoutWatch.com subscriber, or have subscribed to our weekly
newsletter. This newsletter summarizes the breakout events of the week
and provides additional guidance that does not fit into our daily
format. It is published each weekend.
Newsletter Archive: https://www.breakoutwatch.com/content/newsletters
| Inflation Fears Temporarily Hurt
Markets The NASDAQ and other indices took a hit this week as year-on-year inflation hit 6.2% and the increase in just the latest month-on-month was 0.9%. Although the Fed and Administration continue to maintain that this is a temporary phenomenon as a result of supply chain imposed shortages, the investing class fear that 'temporary' may soon become permanent and the Fed will be forced to act soon to raise interest rates, cutting off the supply of cheap money that has fueled the markets' rise. The immediate gut reaction was that the markets sold-off mid-week, but by Friday traders were buying the dip and the major indexes closed flat for the day. For the week, the NASDAQ gave up just 0.7%. Our market trend indicators remain positive 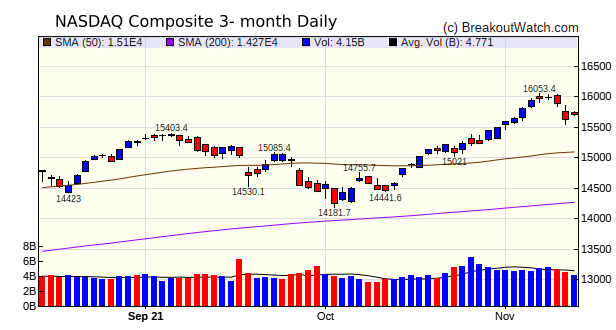 There were just 19 stocks that
closed above their breakout price this week and the small losses
of the overall market kept average breakout returns low to
negative.
|
Our price model has
chosen AQST Aquestive Therapeutics, Inc. (AQST) as the stock
most likely to breakout next week. The stock has shown a rapid
ascent of the cup right side in the last month and closed higher
on above average volume on Friday.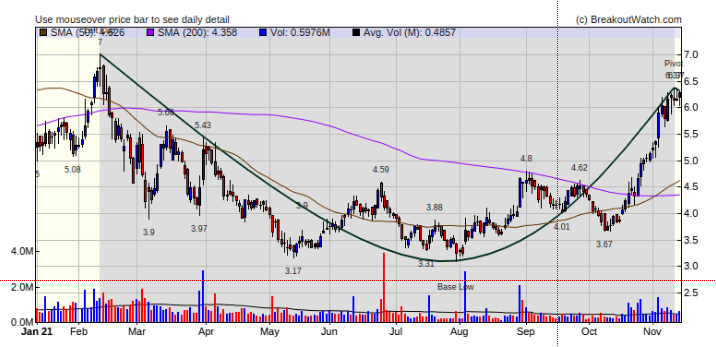 |
| No new features this week |
|
Our latest strategy
suggestions are here.
|
| List | Breakouts | Avg. Gain |
|---|---|---|
| CWH | 5 | -0.34 |
| SQZ | 14 | 0.22 |
| HTF | 0 | |
| HSB | 0 | |
| DB | 0 |
| Brkout Date | Symbol | Base | Squeeze | Brkout Price | Brkout Day Close | RS Rank* | Last Close | Current % off BOP | Gain at Intraday High |
|---|---|---|---|---|---|---|---|---|---|
| 2021-11-08 | AMEH | SQZ | y | 86.00 | 88.21 | 98 | 109.93 | 27.83% | 27.89% |
| *RS Rank on day before breakout. | |||||||||
| Symbol | Company | Industry | RS Rank | Last Close | BoP | % off BoP |
|---|---|---|---|---|---|---|
| AQST | Aquestive Therapeutics, Inc. | Biotechnology | 89 | 6.29 | 6.37 | 98.74 |
| QUIK | QuickLogic Corporation | Semiconductors | 89 | 6.62 | 6.98 | 94.84 |
| PNRG | PrimeEnergy Resources Corporation | Oil & Gas E&P | 89 | 68.5 | 71.59 | 95.68 |
| WETF | WisdomTree Investments, Inc. | Asset Management | 80 | 6.86 | 6.91 | 99.28 |
| CAL | Caleres, Inc. | Footwear & Accessories | 94 | 26.77 | 27.25 | 98.24 |
| *These stocks were selected using our CWH price breakout model. This model selects stocks likely to close above the breakout price at the next session. When backtested over the three years beginning January 2019 until October 28, 2021, 80% of the stocks selected closed above their breakout price. This does not mean that on any day, 80% of the stocks selected will breakout, but it is the expectation over an extended period of time. | ||||||
| Symbol | BO Price |
BO Vol. |
Company | Industry | RS Rank |
Last Close |
|---|---|---|---|---|---|---|
| PBF | 16.46 | 6,442,814 | PBF Energy Inc. | Oil & Gas Refining & Marketing | 96 | 15.49 |
| OII | 16.36 | 1,230,022 | Oceaneering International - Inc. | Oil & Gas Equipment & Services | 91 | 12.84 |
| AQST | 6.37 | 728,527 | Aquestive Therapeutics - Inc. | Biotechnology | 89 | 6.29 |
| GGAL | 12.50 | 1,401,845 | Grupo Financiero Galicia S.A. | Banks - Regional | 88 | 11.52 |
| HT | 11.82 | 691,615 | Hersha Hospitality Trust Class A | REIT - Hotel & Motel | 88 | 11.16 |
| PRQR | 8.67 | 1,180,244 | ProQR Therapeutics N.V. | Biotechnology | 88 | 7.80 |
| GOSS | 14.30 | 845,647 | Gossamer Bio - Inc. | Biotechnology | 85 | 12.08 |
| PUMP | 10.80 | 1,272,290 | ProPetro Holding Corp. | Oil & Gas Equipment & Services | 85 | 9.21 |
| WETF | 6.91 | 1,223,830 | WisdomTree Investments - Inc. | Asset Management | 80 | 6.86 |
| These stocks meet our suggested screening factors
for our Cup and Handle Chart Pattern watchlist. See Revised Rules for Trading Cup and Handle Breakouts |
||||||
| Index | Value | Change Week | Change YTD | Trend1 |
|---|---|---|---|---|
| Dow | 36100.3 |
-0.63% | 17.95% | Up |
| NASDAQ | 15861 |
-0.69% | 23.07% | Up |
| S&P 500 | 4682.85 |
-0.31% | 24.68% | Up |
|
1The Market Trend is derived from
our proprietary market model. The market model is described on
the site here.
2The site also shows industry rankings based on fundamentals, combined technical and fundamentals, and on price alone. The site also shows daily industry movements. |
||||
| 1 Week | 13 Weeks | 26 Weeks | Year-to-Date |
|---|---|---|---|
| S&P 500 |
NASDAQ Composite 7 |
NASDAQ Composite 18.1 |
S&P 500 24.68 |
| 1 Week | 3 Weeks | 13 Weeks | 26 Weeks |
|---|---|---|---|
| Uranium |
Thermal Coal |
Uranium |
Silver |
| Aerospace & Defense 0 |
Aerospace & Defense 0 |
Aerospace & Defense 0 |
Aerospace & Defense 0 |
| Charts of each industry rank and performance over 12 months are available on the site | |||
If you received this newsletter from a friend and you would like to receive it regularly please go to the BreakoutWatch.com site and you will then be able to register to receive the newsletter.
Copyright (c) 11/13/2021 Proactive Technologies, LLC dba
BreakoutWatch.com. All rights reserved.
" BreakoutWatch," the BreakoutWatch.com "eye" logo, and the slogan
"tomorrow's breakouts today" are service marks of Proactive Technologies
LLC. All other marks are the property of their respective owners, and
are used for descriptive purposes only.
BreakoutWatch is not affiliated with Investor's Business Daily or with Mr. William O'Neil. Our site, research and analysis is supported entirely by subscription and is free from advertising.