Breakoutwatch Weekly Summary 12/11/21
You are receiving this email because you are or were a
BreakoutWatch.com subscriber, or have subscribed to our weekly
newsletter. This newsletter summarizes the breakout events of the week
and provides additional guidance that does not fit into our daily
format. It is published each weekend.
Newsletter Archive: https://www.breakoutwatch.com/content/newsletters
| Cup and Handle Pattern Returns to
Leadership Role After last weeks failure to deliver positive gains, the cup and handle pattern returned to its historical leadership position with average breakout gains of 6.7%. The number of breakouts was well below average but that is explained by there being comparatively few stocks on the cup and handle watchlist. For example, for Friday's session there were only 17 breakout candidates. This was a very positive week for the markets with the S&P 500 closing at a new high on Friday after a 3.8% gain for the week. The DJI added 4% while the NASDAQ lagged slightly with a 3.6% gain. Tuesday saw the strongest gains with a relief rally after it appeared the Omicron Covid strain would be less deadly than first thought and that the current crop of vaccines would be effective against it. Friday's news that y-on-y inflation stood at 6.8% failed to spook that markets as might have been expected. Instead it was a seen as positive for earnings as higher prices can lead to higher profits. 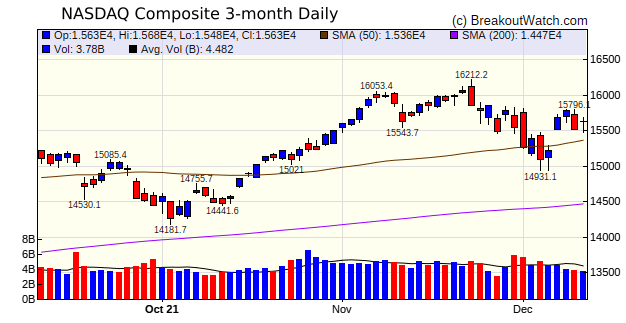 |
| First US
Bankshares FUSB (First US Bankshares ) was our price model's pick as the Cup and Handle pattern stock most likely to breakout at the next session. The stock was selected on the strength of closing higher on two above average volume days on the right side of the handle. Should FUSB breakout, there is a possible gain of 6% to the left side of the cup. The chart shows substantial volatility with large intraday swings, so a breakout could be quickly followed by profit taking. 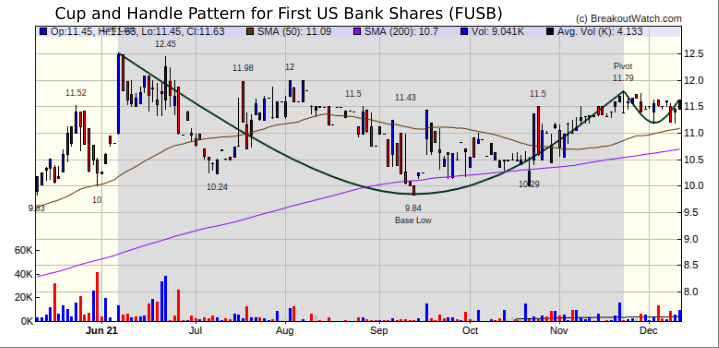 |
| New Chart Presentation Style Users of the desktop site will notice a change in how charts are presented from the "Stock Chart" and "Technical Analysis Chart" links. This was done to improve the experience for users of the site in their phone or tablet making the site more responsive. Work on improving the presentation on phones and tablets is continuing and a phone app will be released in the near future. |
|
Our latest strategy
suggestions are here.
|
| List | Breakouts | Avg. Gain |
|---|---|---|
| CWH | 4 | 6.78 |
| SQZ | 5 | 1.13 |
| HTF | 1 | 2.68 |
| HSB | 0 | |
| DB | 0 |
| Brkout Date | Symbol | Base | Squeeze | Brkout Price | Brkout Day Close | RS Rank* | Last Close | Current % off BOP | Gain at Intraday High |
|---|---|---|---|---|---|---|---|---|---|
| 2021-12-06 | GRBK | CWH | n | 27.91 | 30.54 | 87 | 31.89 | 14.26% | 15.37% |
| 2021-12-08 | ARLO | CWH | n | 8.41 | 8.94 | 0 | 9.03 | 7.37% | 13.79% |
| *RS Rank on day before breakout. | |||||||||
| Symbol | Company | Industry | RS Rank | Last Close | BoP | % off BoP |
|---|---|---|---|---|---|---|
| FUSB | First US Bancshares, Inc. | Banks - Regional | 84 | 11.63 | 11.79 | 98.64 |
| *These stocks were selected using our CWH price breakout model. This model selects stocks likely to close above the breakout price at the next session. When backtested over the three years beginning January 2019 until October 28, 2021, 80% of the stocks selected closed above their breakout price. This does not mean that on any day, 80% of the stocks selected will breakout, but it is the expectation over an extended period of time. | ||||||
| Symbol | BO Price |
BO Vol. |
Company | Industry | RS Rank |
Last Close |
|---|---|---|---|---|---|---|
| PBF | 16.46 | 4,958,012 | PBF Energy Inc. | Oil & Gas Refining & Marketing | 80 | 12.79 |
| These stocks meet our suggested screening factors
for our Cup and Handle Chart Pattern watchlist. See Revised Rules for Trading Cup and Handle Breakouts |
||||||
| Index | Value | Change Week | Change YTD | Trend1 |
|---|---|---|---|---|
| Dow | 35971 |
4.02% | 17.53% | Down |
| NASDAQ | 15630.6 |
3.61% | 21.28% | Down |
| S&P 500 | 4712.02 |
3.82% | 25.45% | Down |
|
1The Market Trend is derived from
our proprietary market model. The market model is described on
the site here.
2The site also shows industry rankings based on fundamentals, combined technical and fundamentals, and on price alone. The site also shows daily industry movements. |
||||
| 1 Week | 13 Weeks | 26 Weeks | Year-to-Date |
|---|---|---|---|
| Dow Jones |
S&P 500 3.41 |
NASDAQ Composite 11.1 |
S&P 500 25.45 |
| 1 Week | 3 Weeks | 13 Weeks | 26 Weeks |
|---|---|---|---|
| REIT - Residential |
Uranium |
Aluminum |
Silver |
| Aerospace & Defense 0 |
Aerospace & Defense 0 |
Aerospace & Defense 0 |
Aerospace & Defense 0 |
| Charts of each industry rank and performance over 12 months are available on the site | |||
If you received this newsletter from a friend and you would like to receive it regularly please go to the BreakoutWatch.com site and you will then be able to register to receive the newsletter.
Copyright (c) 12/11/2021 Proactive Technologies, LLC dba
BreakoutWatch.com. All rights reserved.
" BreakoutWatch," the BreakoutWatch.com "eye" logo, and the slogan
"tomorrow's breakouts today" are service marks of Proactive Technologies
LLC. All other marks are the property of their respective owners, and
are used for descriptive purposes only.
BreakoutWatch is not affiliated with Investor's Business Daily or with Mr. William O'Neil. Our site, research and analysis is supported entirely by subscription and is free from advertising.