Breakoutwatch Weekly Summary 01/22/22
You are receiving this email because you are or were a
BreakoutWatch.com subscriber, or have subscribed to our weekly
newsletter. This newsletter summarizes the breakout events of the week
and provides additional guidance that does not fit into our daily
format. It is published each weekend.
Newsletter Archive: https://www.breakoutwatch.com/content/newsletters
Download our Android App.![]()
|
NASDAQ Loses 7.6% on Earnings
and Inflation Fears
The NASDAQ Composite is now well
into a correction being 15% off its Nov. 22 high. The Q4
earnings reports got off to a bad start with Netflix losing 20%
after reporting slower subscriber growth in the fourth quarter,
This followed Peloton losing 20% the day before so fear that
growth stocks are in jeopardy has spread. A sign that growth
stock investors are jittery is that each buy-the-dip move is
followed by selling to capture what little upside profit is
available.
Inflation at 7% may recede as
supply chain issues are resolved but Goldman Sachs CEO said that
this could be replaced by wage inflation as companies are being
forced to pay higher wages to attract workers. Unless companies
are able to raise prices, this will result in lower profit
margins and lower stock prices.
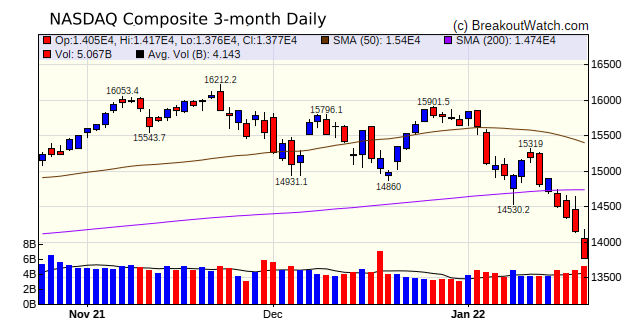 Needless to say, profitable
breakouts are hard to come by in a falling market and just one
breakout gained more than 5% this week. Danaos Corporation (DAC)
gained 13.5% after breakout from a 3 month long Volatility
Squeeze.
|
Adams Resources
& Energy, Inc. [AE] is ranked 14th in the Oil and Gas
Integrated group. On Friday it climbed the right side of a CWH
handle on 3 times average volume. If AE should breakout there is
a potential upside value of 10% to the November 4 high of $34.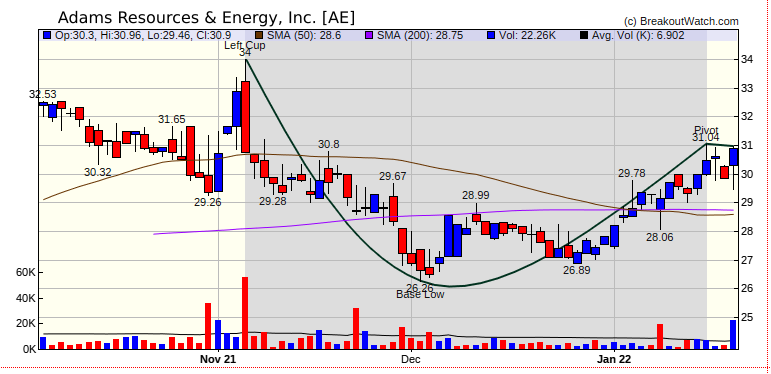 |
| No new features this week |
|
Our latest strategy
suggestions are here.
|
| List | Breakouts | Avg. Gain |
|---|---|---|
| CWH | 4 | -1.87 |
| SQZ | 7 | -1.93 |
| HTF | 0 | |
| HSB | 0 | |
| DB | 0 |
| Brkout Date | Symbol | Base | Squeeze | Brkout Price | Brkout Day Close | RS Rank* | Last Close | Current % off BOP | Gain at Intraday High |
|---|---|---|---|---|---|---|---|---|---|
| 2022-01-18 | DAC | SQZ | y | 74.06 | 79.87 | 95 | 78.12 | 5.48% | 13.48% |
| *RS Rank on day before breakout. | |||||||||
| Symbol | Company | Industry | RS Rank | Last Close | BoP | % off BoP |
|---|---|---|---|---|---|---|
| AE | Adams Resources & Energy, Inc. | Oil & Gas Integrated | 88 | 30.9 | 31.04 | 99.55 |
| SOHON | Sotherly Hotels Inc. | REIT - Hotel & Motel | 89 | 17.73 | 18.25 | 97.15 |
| FXNC | First National Corporation | Banks - Regional | 89 | 22.99 | 23.85 | 96.39 |
| HWBK | Hawthorn Bancshares, Inc. | Banks - Regional | 91 | 25.785 | 26.12 | 98.72 |
| *These stocks were selected using our CWH price breakout model. This model selects stocks likely to close above the breakout price at the next session. When backtested over the three years beginning January 2019 until October 28, 2021, 80% of the stocks selected closed above their breakout price. This does not mean that on any day, 80% of the stocks selected will breakout, but it is the expectation over an extended period of time. | ||||||
| Symbol | BO Price |
BO Vol. |
Company | Industry | RS Rank |
Last Close |
|---|---|---|---|---|---|---|
| TSRI | 14.47 | 1,300,055 | TSR - Inc. | Software - Application | 95 | 11.20 |
| KRP | 16.10 | 535,976 | Kimbell Royalty Partners | Oil & Gas E&P | 94 | 14.40 |
| ETRN | 11.22 | 4,775,897 | Equitrans Midstream Corporation | Oil & Gas Midstream | 92 | 10.34 |
| FULT | 19.17 | 1,421,338 | Fulton Financial Corporation | Banks - Regional | 88 | 17.82 |
| WSR | 10.50 | 643,339 | Whitestone REIT | REIT - Retail | 88 | 10.31 |
| PUMP | 10.80 | 1,198,998 | ProPetro Holding Corp. | Oil & Gas Equipment & Services | 87 | 9.99 |
| TRQ | 17.46 | 1,296,680 | Turquoise Hill Resources | Copper | 87 | 15.45 |
| BSM | 12.02 | 557,595 | Black Stone Minerals - L.P. | Oil & Gas E&P | 81 | 10.97 |
| These stocks meet our suggested screening factors
for our Cup and Handle Chart Pattern watchlist. See Revised Rules for Trading Cup and Handle Breakouts |
||||||
| Index | Value | Change Week | Change YTD | Trend1 |
|---|---|---|---|---|
| Dow | 34265.4 |
-4.58% | -5.7% | Down |
| NASDAQ | 13768.9 |
-7.55% | -11.99% | Down |
| S&P 500 | 4397.94 |
-5.68% | -7.73% | Down |
|
1The Market Trend is derived from
our proprietary market model. The market model is described on
the site here.
2The site also shows industry rankings based on fundamentals, combined technical and fundamentals, and on price alone. The site also shows daily industry movements. |
||||
| 1 Week | 13 Weeks | 26 Weeks | Year-to-Date |
|---|---|---|---|
| Dow Jones |
S&P 500 -3.23 |
S&P 500 -0.32 |
Dow Jones -5.7 |
| 1 Week | 3 Weeks | 13 Weeks | 26 Weeks |
|---|---|---|---|
| Oil & Gas Integrated |
REIT - Residential |
Thermal Coal |
Silver |
| Aerospace & Defense 0 |
Aerospace & Defense 0 |
Aerospace & Defense 0 |
Aerospace & Defense 0 |
| Charts of each industry rank and performance over 12 months are available on the site | |||
If you received this newsletter from a friend and you would like to receive it regularly please go to the BreakoutWatch.com site and you will then be able to register to receive the newsletter.
Copyright (c) 01/22/2022 Proactive Technologies, LLC dba
BreakoutWatch.com. All rights reserved.
" BreakoutWatch," the BreakoutWatch.com "eye" logo, and the slogan
"tomorrow's breakouts today" are service marks of Proactive Technologies
LLC. All other marks are the property of their respective owners, and
are used for descriptive purposes only.
BreakoutWatch is not affiliated with Investor's Business Daily or with Mr. William O'Neil. Our site, research and analysis is supported entirely by subscription and is free from advertising.