Breakoutwatch Weekly Summary 01/29/22
You are receiving this email because you are or were a
BreakoutWatch.com subscriber, or have subscribed to our weekly
newsletter. This newsletter summarizes the breakout events of the week
and provides additional guidance that does not fit into our daily
format. It is published each weekend.
Newsletter Archive: https://www.breakoutwatch.com/content/newsletters
Download our Android App.![]()
| Dead Cat Bounce; Follow Through Day
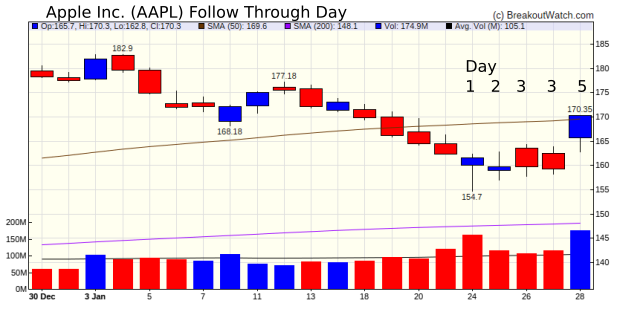
for AAPL The week opened with a strong 6% intraday reversal for the NASDAQ on 1.5% times average volume. The selloff resumed on Tuesday though, confirming that Monday's action was just a dead cat bounce. Volatility continued through the week but closed with another rally for the NASDAQ, closing 3.1% higher, leaving the index essentially flat for the week. Friday's rally followed a strong earnings report from Apple (AAPL) which gained 7%. However, it was clear that investors preferred blue chips when faced with market volatility and the DJI gained 1.3%. 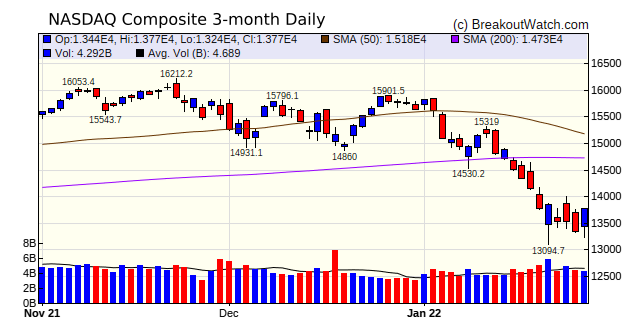 Friday's surge by AAPL could be
considered a 'Follow
Through Day' although the term is normally applied to
major indexes and can indicate a market bottom. In this case,
it is possibly indicating the rout of AAPL is over. Other big
cap tech stocks followed Apple's lead and the Vanguard Mega
Cap index rose 3.8%, also indicating a possible FTD.
 |
| H&R Block Instead of looking for promising cup and handle pattern stocks, I'm starting to focus on stocks that may have bottomed and are starting to rise. H&R Block fell 17.3% from it's high and after gaining 3.1 % just crossed the upper bound of its average true range band. Note that pattern follows that of an FTD as discussed above. With tax season upon us HRB is competing aggressively against Intuit after announcing a mobile banking app, SPRUCE. 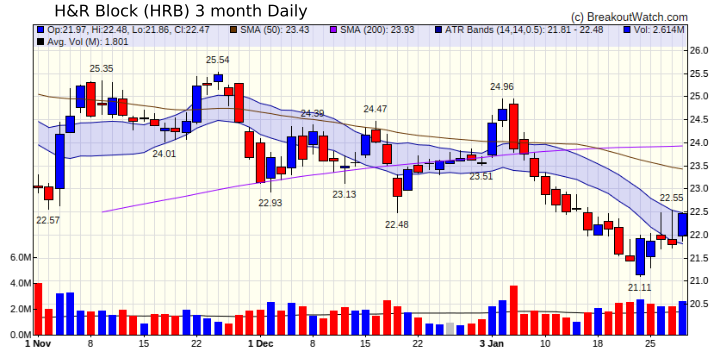 |
| No new features this week |
|
Our latest strategy
suggestions are here.
|
| List | Breakouts | Avg. Gain |
|---|---|---|
| CWH | 10 | -2.67 |
| SQZ | 13 | 1.07 |
| HTF | 0 | |
| HSB | 0 | |
| DB | 0 |
| Brkout Date | Symbol | Base | Squeeze | Brkout Price | Brkout Day Close | RS Rank* | Last Close | Current % off BOP | Gain at Intraday High |
|---|---|---|---|---|---|---|---|---|---|
| 2022-01-27 | DAC | CWH | n | 84.04 | 85.89 | 98 | 91.46 | 8.83% | 8.98% |
| *RS Rank on day before breakout. | |||||||||
| Symbol | Company | Industry | RS Rank | Last Close | BoP | % off BoP |
|---|---|---|---|---|---|---|
| HWBK | Hawthorn Bancshares, Inc. | Banks - Regional | 92 | 25.85 | 26.12 | 98.97 |
| PEBO | Peoples Bancorp Inc. | Banks - Regional | 81 | 32.99 | 34.63 | 95.26 |
| AXP | American Express Company | Credit Services | 90 | 177.06 | 179.23 | 98.79 |
| GCBC | Greene County Bancorp, Inc. | Banks - Regional | 96 | 37.5 | 37.81 | 99.18 |
| NXGN | NextGen Healthcare, Inc. | Health Information Services | 90 | 19.3 | 20.26 | 95.26 |
| *These stocks were selected using our CWH price breakout model. This model selects stocks likely to close above the breakout price at the next session. When backtested over the three years beginning January 2019 until October 28, 2021, 80% of the stocks selected closed above their breakout price. This does not mean that on any day, 80% of the stocks selected will breakout, but it is the expectation over an extended period of time. | ||||||
| Symbol | BO Price |
BO Vol. |
Company | Industry | RS Rank |
Last Close |
|---|---|---|---|---|---|---|
| WTTR | 7.45 | 581,961 | Select Energy Services - Inc. | Oil & Gas Equipment & Services | 89 | 6.45 |
| PUMP | 11.40 | 1,250,160 | ProPetro Holding Corp. | Oil & Gas Equipment & Services | 88 | 10.39 |
| OII | 14.41 | 1,091,540 | Oceaneering International - Inc. | Oil & Gas Equipment & Services | 86 | 13.24 |
| SXC | 7.64 | 1,016,865 | SunCoke Energy - Inc. | Coking Coal | 83 | 6.88 |
| UE | 19.96 | 1,032,984 | Urban Edge Properties | REIT - Diversified | 83 | 18.39 |
| BSM | 12.02 | 553,936 | Black Stone Minerals - L.P. | Oil & Gas E&P | 81 | 11.19 |
| DNOW | 9.83 | 1,487,680 | NOW Inc. | Oil & Gas Equipment & Services | 81 | 8.72 |
| These stocks meet our suggested screening factors
for our Cup and Handle Chart Pattern watchlist. See Revised Rules for Trading Cup and Handle Breakouts |
||||||
| Index | Value | Change Week | Change YTD | Trend1 |
|---|---|---|---|---|
| Dow | 34725.5 |
1.34% | -4.44% | Down |
| NASDAQ | 13770.6 |
0.01% | -11.98% | Down |
| S&P 500 | 4431.85 |
0.77% | -7.01% | Down |
|
1The Market Trend is derived from
our proprietary market model. The market model is described on
the site here.
2The site also shows industry rankings based on fundamentals, combined technical and fundamentals, and on price alone. The site also shows daily industry movements. |
||||
| 1 Week | 13 Weeks | 26 Weeks | Year-to-Date |
|---|---|---|---|
| Dow Jones |
Dow Jones -3.77 |
S&P 500 0.84 |
Dow Jones -4.44 |
| 1 Week | 3 Weeks | 13 Weeks | 26 Weeks |
|---|---|---|---|
| Oil & Gas Integrated |
REIT - Residential |
Uranium |
Silver |
| Aerospace & Defense 0 |
Aerospace & Defense 0 |
Aerospace & Defense 0 |
Aerospace & Defense 0 |
| Charts of each industry rank and performance over 12 months are available on the site | |||
If you received this newsletter from a friend and you would like to receive it regularly please go to the BreakoutWatch.com site and you will then be able to register to receive the newsletter.
Copyright (c) 01/29/2022 Proactive Technologies, LLC dba
BreakoutWatch.com. All rights reserved.
" BreakoutWatch," the BreakoutWatch.com "eye" logo, and the slogan
"tomorrow's breakouts today" are service marks of Proactive Technologies
LLC. All other marks are the property of their respective owners, and
are used for descriptive purposes only.
BreakoutWatch is not affiliated with Investor's Business Daily or with Mr. William O'Neil. Our site, research and analysis is supported entirely by subscription and is free from advertising.