Breakoutwatch Weekly Summary 02/12/22
You are receiving this email because you are or were a
BreakoutWatch.com subscriber, or have subscribed to our weekly
newsletter. This newsletter summarizes the breakout events of the week
and provides additional guidance that does not fit into our daily
format. It is published each weekend.
Newsletter Archive: https://www.breakoutwatch.com/content/newsletters
| Bearish Double Top Bodes Ill for
Major Indexes All three major indexes completed a bearish Double Top formation on Friday when they closed below the support level defined by the lowest price between the two tops. Friday's nadir was prompted by a sobering briefing by National Security Advisor Jake Sullivan warning that Russian invasion of Ukraine could begin at anytime. The markets were already in decline in response to an increase in inflation reported on Wednesday and anticipation of 1% rise in interest rates by July 1. 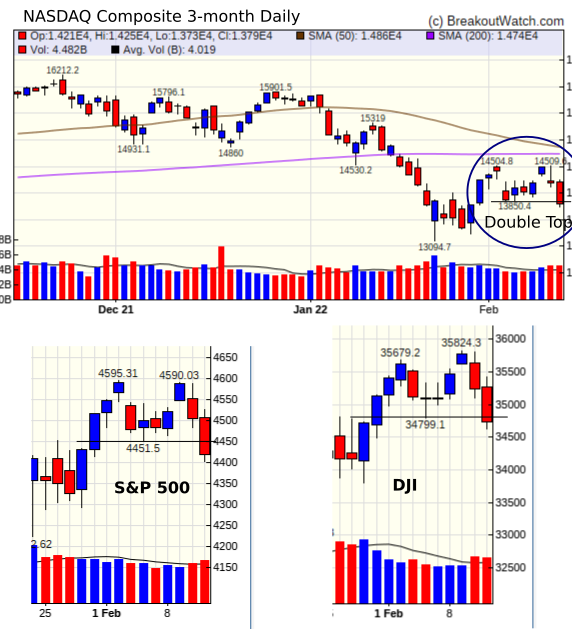 As for the week's breakouts,rising
optimism early in the week brought a total of 72 but gains were
severely reduced by the reaction to the rise in inflation and
fears of war.
|
Following on with
my search to find beaten down stocks that are recovering, I'm
pleased to say that HRB has gained 9.8% since it appeared in
this section 2 weeks ago and last weeks selection BILL, gained
2.2% after a mid-week gain of 13%. This weeks choice is Great
Panther Mining which broke above its upper Average True Range
boundary on Friday with strong volume and high Average
Directional indicator indicating a strong upward trend.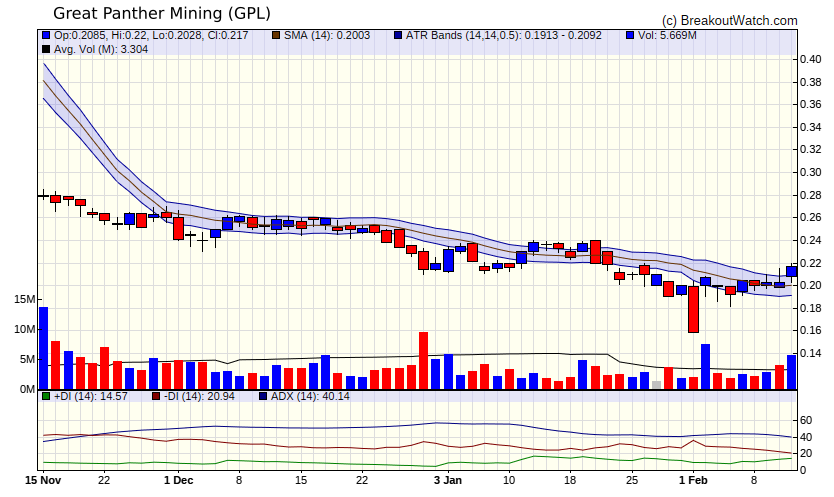 |
| No new features this week |
|
Our latest strategy
suggestions are here.
|
| List | Breakouts | Avg. Gain |
|---|---|---|
| CWH | 21 | 0.95 |
| SQZ | 51 | 0.22 |
| HTF | 0 | |
| HSB | 0 | |
| DB | 0 |
| Brkout Date | Symbol | Base | Squeeze | Brkout Price | Brkout Day Close | RS Rank* | Last Close | Current % off BOP | Gain at Intraday High |
|---|---|---|---|---|---|---|---|---|---|
| 2022-02-07 | NGVC | CWH | y | 15.34 | 16.11 | 89 | 18.52 | 20.73% | 22.1% |
| 2022-02-07 | EVRI | SQZ | y | 20.40 | 21.22 | 80 | 22.44 | 10% | 16.13% |
| 2022-02-10 | PUMP | CWH | n | 11.53 | 11.76 | 92 | 12.55 | 8.85% | 10.54% |
| 2022-02-10 | LPI | SQZ | y | 68.21 | 68.48 | 97 | 73.95 | 8.42% | 9.9% |
| 2022-02-07 | BRT | SQZ | y | 20.77 | 21.16 | 91 | 22.5 | 8.33% | 8.62% |
| 2022-02-10 | CRC | SQZ | y | 40.66 | 41.38 | 95 | 43.18 | 6.2% | 6.47% |
| 2022-02-09 | BAP | SQZ | y | 145.30 | 150.8 | 91 | 153.82 | 5.86% | 9.11% |
| 2022-02-08 | EVRI | SQZ | y | 21.23 | 21.97 | 83 | 22.44 | 5.7% | 11.59% |
| *RS Rank on day before breakout. | |||||||||
| Symbol | Company | Industry | RS Rank | Last Close | BoP | % off BoP |
|---|---|---|---|---|---|---|
| MSBI | Midland States Bancorp, Inc. | Banks - Regional | 93 | 29.9 | 30.58 | 97.78 |
| CVI | CVR Energy Inc. | Oil & Gas Refining & Marketing | 96 | 22.16 | 22.99 | 96.39 |
| ESGR | Enstar Group Limited | Insurance - Diversified | 89 | 266.22 | 270.10 | 98.56 |
| RMBI | Richmond Mutual Bancorporation, Inc. | Banks - Regional | 89 | 16.57 | 16.68 | 99.34 |
| THFF | First Financial Corporation Indiana | Banks - Regional | 84 | 45.99 | 46.23 | 99.48 |
| AE | Adams Resources & Energy, Inc. | Oil & Gas Integrated | 88 | 31.39 | 32.67 | 96.08 |
| *These stocks were selected using our CWH price breakout model. This model selects stocks likely to close above the breakout price at the next session. When backtested over the three years beginning January 2019 until October 28, 2021, 80% of the stocks selected closed above their breakout price. This does not mean that on any day, 80% of the stocks selected will breakout, but it is the expectation over an extended period of time. | ||||||
| Symbol | BO Price |
BO Vol. |
Company | Industry | RS Rank |
Last Close |
|---|---|---|---|---|---|---|
| WTTR | 7.71 | 636,085 | Select Energy Services - Inc. | Oil & Gas Equipment & Services | 94 | 7.45 |
| SXC | 7.90 | 1,033,588 | SunCoke Energy - Inc. | Coking Coal | 90 | 7.70 |
| BSM | 12.39 | 560,381 | Black Stone Minerals - L.P. | Oil & Gas E&P | 87 | 12.05 |
| These stocks meet our suggested screening factors
for our Cup and Handle Chart Pattern watchlist. See Revised Rules for Trading Cup and Handle Breakouts |
||||||
| Index | Value | Change Week | Change YTD | Trend1 |
|---|---|---|---|---|
| Dow | 34738.1 |
-1% | -4.4% | Down |
| NASDAQ | 13791.2 |
-2.18% | -11.85% | Down |
| S&P 500 | 4418.64 |
-1.82% | -7.29% | Down |
|
1The Market Trend is derived from
our proprietary market model. The market model is described on
the site here.
2The site also shows industry rankings based on fundamentals, combined technical and fundamentals, and on price alone. The site also shows daily industry movements. |
||||
| 1 Week | 13 Weeks | 26 Weeks | Year-to-Date |
|---|---|---|---|
| Dow Jones |
Dow Jones -5.64 |
S&P 500 -1.1 |
Dow Jones -4.4 |
| 1 Week | 3 Weeks | 13 Weeks | 26 Weeks |
|---|---|---|---|
| Oil & Gas Integrated |
REIT - Residential |
Thermal Coal |
Solar |
| Aerospace & Defense 0 |
Aerospace & Defense 0 |
Aerospace & Defense 0 |
Aerospace & Defense 0 |
| Charts of each industry rank and performance over 12 months are available on the site | |||
If you received this newsletter from a friend and you would like to receive it regularly please go to the BreakoutWatch.com site and you will then be able to register to receive the newsletter.
Copyright (c) 02/12/2022 Proactive Technologies, LLC dba
BreakoutWatch.com. All rights reserved.
" BreakoutWatch," the BreakoutWatch.com "eye" logo, and the slogan
"tomorrow's breakouts today" are service marks of Proactive Technologies
LLC. All other marks are the property of their respective owners, and
are used for descriptive purposes only.
BreakoutWatch is not affiliated with Investor's Business Daily or with Mr. William O'Neil. Our site, research and analysis is supported entirely by subscription and is free from advertising.