Breakoutwatch Weekly Summary 03/05/22
You are receiving this email because you are or were a
BreakoutWatch.com subscriber, or have subscribed to our weekly
newsletter. This newsletter summarizes the breakout events of the week
and provides additional guidance that does not fit into our daily
format. It is published each weekend.
Newsletter Archive: https://www.breakoutwatch.com/content/newsletters
| Strong Breakout Performance this
Week Despite Geopolitical Risks As the summary of the week's breakouts shows, 16 breakouts gained 5% or more this week despite the war in Ukraine. The standout performer was KLXE which stands to profit from likely increased oil production in the US to compensate for rising global oil prices. The major indexes continued their decline with the NASDAQ composite leading the trend with a loss of 2.8%. 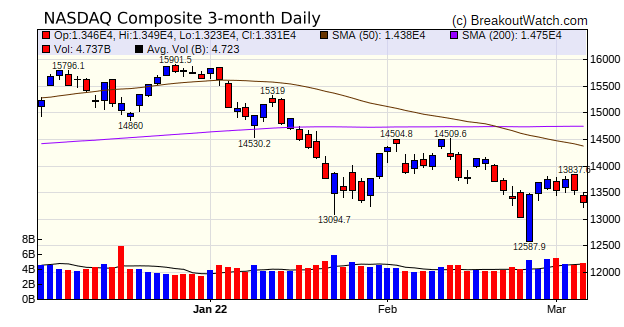 |
GeoPark Limited
engages in the exploration, development, and production of oil
and gas reserves in Chile, Colombia, Brazil, Argentina, Peru,
and Ecuador. It has a strong Relative Strength Rank of 92, a
technical score of 5/5 and fundamental score of 4/5. GPRK can
benefit from South American oil production as the world prices
move higher.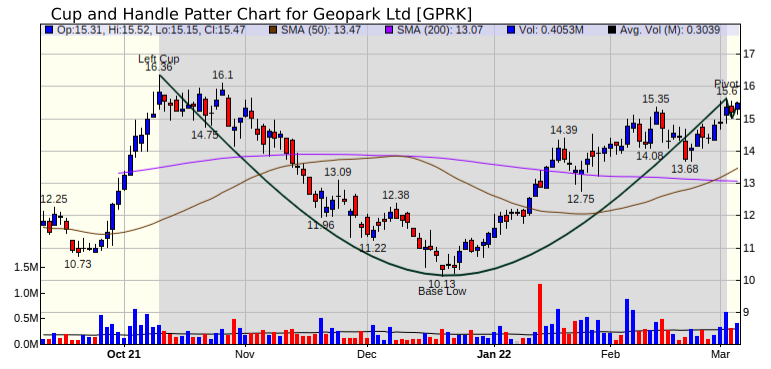 |
| No new features this week |
|
Our latest strategy
suggestions are here.
|
| List | Breakouts | Avg. Gain |
|---|---|---|
| CWH | 29 | 4.12 |
| SQZ | 57 | 1.71 |
| HTF | 2 | 33.97 |
| HSB | 0 | |
| DB | 0 |
| Brkout Date | Symbol | Base | Squeeze | Brkout Price | Brkout Day Close | RS Rank* | Last Close | Current % off BOP | Gain at Intraday High |
|---|---|---|---|---|---|---|---|---|---|
| 2022-02-28 | KLXE | HTF | n | 6.44 | 6.7 | 53 | 10.41 | 61.65% | 62.89% |
| 2022-03-02 | BTU | CWH | n | 19.60 | 20.81 | 99 | 26.35 | 34.44% | 39.18% |
| 2022-02-28 | GOGO | SQZ | y | 14.09 | 14.24 | 88 | 16.39 | 16.32% | 20.01% |
| 2022-02-28 | NOG | SQZ | y | 23.61 | 25.08 | 96 | 27.39 | 16.01% | 18.76% |
| 2022-03-02 | MNRL | SQZ | y | 23.99 | 25.4 | 96 | 27.44 | 14.38% | 14.42% |
| 2022-02-28 | LPI | SQZ | y | 73.92 | 76.56 | 98 | 83 | 12.28% | 13.4% |
| 2022-02-28 | MRC | CWH | n | 10.06 | 10.1 | 93 | 11.23 | 11.63% | 11.83% |
| 2022-02-28 | VALE | CWH | n | 18.15 | 18.49 | 93 | 20.15 | 11.02% | 11.07% |
| 2022-03-02 | NE | CWH | y | 27.50 | 28 | 89 | 30.32 | 10.25% | 12.25% |
| 2022-03-02 | AE | CWH | y | 32.67 | 33.45 | 89 | 35.6831 | 9.22% | 10.82% |
| 2022-03-01 | NOG | SQZ | y | 25.09 | 25.66 | 97 | 27.39 | 9.17% | 11.76% |
| 2022-03-03 | NE | SQZ | y | 28.01 | 29.34 | 91 | 30.32 | 8.25% | 10.21% |
| 2022-03-02 | PCRX | SQZ | y | 67.68 | 71.28 | 89 | 72.33 | 6.87% | 6.9% |
| 2022-03-02 | FDUS | CWH | n | 18.71 | 18.74 | 84 | 19.94 | 6.57% | 7.27% |
| 2022-02-28 | NEX | HTF | n | 7.79 | 7.96 | 99 | 8.28 | 6.29% | 9.05% |
| 2022-03-02 | AVA | SQZ | y | 44.04 | 44.55 | 87 | 46.46 | 5.5% | 5.63% |
| *RS Rank on day before breakout. | |||||||||
| Symbol | Company | Industry | RS Rank | Last Close | BoP | % off BoP |
|---|---|---|---|---|---|---|
| GPRK | Geopark Ltd | Oil & Gas E&P | 92 | 15.47 | 15.60 | 99.17 |
| BSM | Black Stone Minerals, L.P. | Oil & Gas E&P | 91 | 12.4 | 12.50 | 99.2 |
| INSW | International Seaways, Inc. | Oil & Gas Midstream | 90 | 18.49 | 18.98 | 97.42 |
| GKOS | Glaukos Corporation | Medical Instruments & Supplies | 83 | 54.34 | 57.53 | 94.46 |
| *These stocks were selected using our CWH price breakout model. This model selects stocks likely to close above the breakout price at the next session. When backtested over the three years beginning January 2019 until October 28, 2021, 80% of the stocks selected closed above their breakout price. This does not mean that on any day, 80% of the stocks selected will breakout, but it is the expectation over an extended period of time. | ||||||
| Symbol | BO Price |
BO Vol. |
Company | Industry | RS Rank |
Last Close |
|---|---|---|---|---|---|---|
| BSM | 12.50 | 588,359 | Black Stone Minerals - L.P. | Oil & Gas E&P | 91 | 12.40 |
| INSW | 18.98 | 894,853 | International Seaways - Inc. | Oil & Gas Midstream | 90 | 18.49 |
| KYN | 8.91 | 1,116,145 | Kayne Anderson Energy Infrastructure Fund - Inc. | Asset Management | 90 | 8.84 |
| TUP | 19.86 | 1,298,487 | Tupperware Brands Corporation | Packaging & Containers | 88 | 19.38 |
| UUUU | 9.08 | 4,820,671 | Energy Fuels Inc | Uranium | 88 | 8.19 |
| XHR | 19.46 | 817,131 | Xenia Hotels & Resorts - Inc. | REIT - Hotel & Motel | 88 | 18.34 |
| ORAN | 12.56 | 1,459,997 | Orange | Telecom Services | 83 | 11.36 |
| INN | 10.58 | 884,871 | Summit Hotel Properties - Inc. | REIT - Hotel & Motel | 82 | 9.76 |
| These stocks meet our suggested screening factors
for our Cup and Handle Chart Pattern watchlist. See Revised Rules for Trading Cup and Handle Breakouts |
||||||
| Index | Value | Change Week | Change YTD | Trend1 |
|---|---|---|---|---|
| Dow | 33614.8 |
-1.3% | -7.49% | Down |
| NASDAQ | 13313.4 |
-2.78% | -14.9% | Down |
| S&P 500 | 4328.87 |
-1.27% | -9.18% | Down |
|
1The Market Trend is derived from
our proprietary market model. The market model is described on
the site here.
2The site also shows industry rankings based on fundamentals, combined technical and fundamentals, and on price alone. The site also shows daily industry movements. |
||||
| 1 Week | 13 Weeks | 26 Weeks | Year-to-Date |
|---|---|---|---|
| S&P 500 |
Dow Jones -4.62 |
S&P 500 -4.55 |
Dow Jones -7.49 |
| 1 Week | 3 Weeks | 13 Weeks | 26 Weeks |
|---|---|---|---|
| Oil & Gas Integrated |
Oil & Gas Integrated |
Uranium |
Home Improvement Retail |
| Aerospace & Defense 0 |
Aerospace & Defense 0 |
Aerospace & Defense 0 |
Aerospace & Defense 0 |
| Charts of each industry rank and performance over 12 months are available on the site | |||
If you received this newsletter from a friend and you would like to receive it regularly please go to the BreakoutWatch.com site and you will then be able to register to receive the newsletter.
Copyright (c) 03/05/2022 Proactive Technologies, LLC dba
BreakoutWatch.com. All rights reserved.
" BreakoutWatch," the BreakoutWatch.com "eye" logo, and the slogan
"tomorrow's breakouts today" are service marks of Proactive Technologies
LLC. All other marks are the property of their respective owners, and
are used for descriptive purposes only.
BreakoutWatch is not affiliated with Investor's Business Daily or with Mr. William O'Neil. Our site, research and analysis is supported entirely by subscription and is free from advertising.