Breakoutwatch Weekly Summary 05/07/22
You are receiving this email because you are or were a
BreakoutWatch.com subscriber, or have subscribed to our weekly
newsletter. This newsletter summarizes the breakout events of the week
and provides additional guidance that does not fit into our daily
format. It is published each weekend.
Newsletter Archive: https://www.breakoutwatch.com/content/newsletters
| Recession Fears Dominate;
Volatility Provides Breakout Opportunities from the Volatility
Squeeze Pattern This was a volatile week that saw the markets respond positively to the FOMC decision to raise the overnight funds rate by 0.5% when a 0.75% increase was feared. Reality set in on on Thursday,however, as the markets feared a repeat of the Volcker bitter medicine that was needed to squash inflation in the late 70's. In 1980 the overnight rate hit 20% and a recession followed. For the week, the NASDAQ lost 1.5% and is now 25% below its November high. 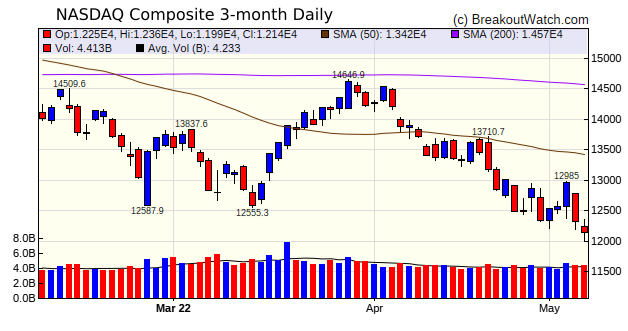 The volatility nevertheless
provided opportunities for several strong breakouts, mostly from
Volatility Squeeze pattern. Building products supplier Bluelinx
Holdings Inc. (BXC) soared 37% higher.
|
| Cross Timbers
Royalty Trust (CRT) CRT are an 'Express Trust' involved in Oil and Gas Exploration and production in Texas, Oklahoma, and New Mexico; CRT is the only cup with handle pattern selected by our model for CWH stocks to breakout at the next session 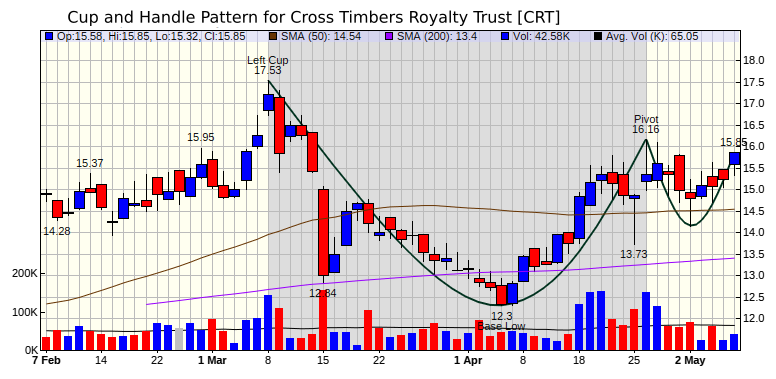 |
| No new features this week |
|
Our latest strategy
suggestions are here.
|
| List | Breakouts | Avg. Gain |
|---|---|---|
| CWH | 10 | 1.27 |
| SQZ | 41 | 1.47 |
| HTF | 2 | -6.15 |
| HSB | 0 | |
| DB | 0 |
| Brkout Date | Symbol | Base | Squeeze | Brkout Price | Brkout Day Close | RS Rank* | Last Close | Current % off BOP | Gain at Intraday High |
|---|---|---|---|---|---|---|---|---|---|
| 2022-05-03 | BXC | SQZ | y | 70.46 | 76.56 | 95 | 96.83 | 37.43% | 41.92% |
| 2022-05-02 | INOD | SQZ | y | 7.30 | 8.05 | 90 | 8.5 | 16.44% | 23.29% |
| 2022-05-02 | WIRE | SQZ | y | 112.82 | 117.4 | 92 | 128.61 | 14% | 19.57% |
| 2022-05-03 | WIRE | SQZ | y | 117.41 | 123.45 | 93 | 128.61 | 9.54% | 14.9% |
| 2022-05-03 | AMAL | SQZ | y | 18.45 | 18.95 | 90 | 19.87 | 7.7% | 10.08% |
| 2022-05-05 | K | SQZ | y | 67.86 | 70.23 | 87 | 72.73 | 7.18% | 8.02% |
| 2022-05-05 | LPG | CWH | n | 16.20 | 17.26 | 92 | 17.32 | 6.91% | 8.58% |
| 2022-05-03 | PSX | CWH | n | 90.64 | 90.79 | 89 | 96.36 | 6.31% | 6.75% |
| 2022-05-03 | INOD | SQZ | y | 8.06 | 8.68 | 93 | 8.5 | 5.46% | 11.66% |
| *RS Rank on day before breakout. | |||||||||
| Symbol | Company | Industry | RS Rank | Last Close | BoP | % off BoP |
|---|---|---|---|---|---|---|
| INSW | International Seaways, Inc. | Oil & Gas Midstream | 96 | 22.77 | 22.98 | 99.09 |
| RNDB | Randolph Bancorp, Inc. | Banks - Regional | 90 | 26.38 | 26.63 | 99.06 |
| CRT | Cross Timbers Royalty Trust | Oil & Gas E&P | 94 | 15.85 | 16.16 | 98.08 |
| *These stocks were selected using our CWH price breakout model. This model selects stocks likely to close above the breakout price at the next session. When backtested over the three years beginning January 2019 until October 28, 2021, 80% of the stocks selected closed above their breakout price. This does not mean that on any day, 80% of the stocks selected will breakout, but it is the expectation over an extended period of time. | ||||||
| Symbol | BO Price |
BO Vol. |
Company | Industry | RS Rank |
Last Close |
|---|---|---|---|---|---|---|
| BLU | 9.09 | 1,013,430 | BELLUS Health Inc. | Biotechnology | 98 | 7.72 |
| TUFN | 13.00 | 1,132,006 | Tufin Software Technologi | Software - Infrastructure | 96 | 12.82 |
| MRTN | 18.92 | 674,197 | Marten Transport - Ltd. | Trucking | 90 | 18.25 |
| NRZ | 11.75 | 8,188,715 | New Residential Investment Corp. | REIT - Mortgage | 88 | 11.13 |
| KT | 15.30 | 1,293,322 | KT Corporation | Telecom Services | 86 | 13.90 |
| PSO | 11.07 | 1,069,774 | Pearson - Plc | Publishing | 84 | 9.53 |
| These stocks meet our suggested screening factors
for our Cup and Handle Chart Pattern watchlist. See Revised Rules for Trading Cup and Handle Breakouts |
||||||
| Index | Value | Change Week | Change YTD | Trend1 |
|---|---|---|---|---|
| Dow | 32899.4 |
-0.24% | -9.46% | Down |
| NASDAQ | 12144.7 |
-1.54% | -22.37% | Down |
| S&P 500 | 4123.34 |
-0.21% | -13.49% | Down |
|
1The Market Trend is derived from
our proprietary market model. The market model is described on
the site here.
2The site also shows industry rankings based on fundamentals, combined technical and fundamentals, and on price alone. The site also shows daily industry movements. |
||||
| 1 Week | 13 Weeks | 26 Weeks | Year-to-Date |
|---|---|---|---|
| S&P 500 |
Dow Jones -6.24 |
Dow Jones -9.44 |
Dow Jones -9.46 |
| 1 Week | 3 Weeks | 13 Weeks | 26 Weeks |
|---|---|---|---|
| Thermal Coal |
Thermal Coal |
Uranium |
Aluminum |
| Aerospace & Defense 0 |
Aerospace & Defense 0 |
Aerospace & Defense 0 |
Aerospace & Defense 0 |
| Charts of each industry rank and performance over 12 months are available on the site | |||
If you received this newsletter from a friend and you would like to receive it regularly please go to the BreakoutWatch.com site and you will then be able to register to receive the newsletter.
Copyright (c) 05/07/2022 Proactive Technologies, LLC dba
BreakoutWatch.com. All rights reserved.
" BreakoutWatch," the BreakoutWatch.com "eye" logo, and the slogan
"tomorrow's breakouts today" are service marks of Proactive Technologies
LLC. All other marks are the property of their respective owners, and
are used for descriptive purposes only.
BreakoutWatch is not affiliated with Investor's Business Daily or with Mr. William O'Neil. Our site, research and analysis is supported entirely by subscription and is free from advertising.