Breakoutwatch Weekly Summary 06/25/22
You are receiving this email because you are or were a
BreakoutWatch.com subscriber, or have subscribed to our weekly
newsletter. This newsletter summarizes the breakout events of the week
and provides additional guidance that does not fit into our daily
format. It is published each weekend.
Newsletter Archive: https://www.breakoutwatch.com/content/newsletters
| NASDAQ Gains 7.5% Led By Mega Caps;
Friday a Possible FTD Last Friday's bounce from an oversold level continued this week led by the mega cap stocks. For example, the Vanguard Mega-Cap Growth ETF (MGK) gained 8.0%. Briefing.com postulated this was likely due their perceived ability to hold their strength in the face of a weakening economy. MGK is down 26.4% for the year. Looking at the chart, its possible to consider Friday a "follow through day" being on the 6th day after the upturn on June 17. However, we saw a recent potential FTD on May 13 which quickly faded. With so much uncertainty regarding inflation, earnings and the war, it's possible this rally will fail also. Our Trend Reversal signals continue to remain negative. 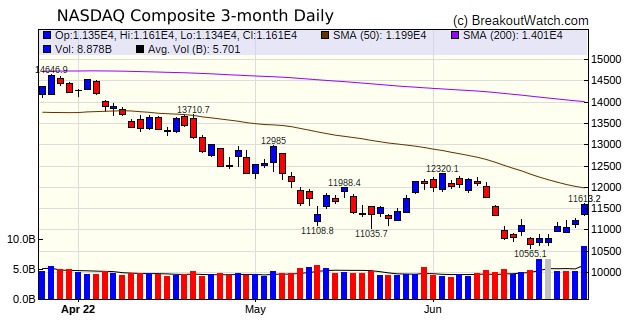 The upswing did bring some positive
breakouts, with 31 gaining at least 5%. See table below.
|
| Vanguard Real
Estate ETF (VNQ) As before, I look for stocks that are potentially starting to build a new base by looking for those moving above their Average True Range. This week there were 59 that met that test, with 14 of them being REITs. REITs have been beaten down, but are now attracting buyers because of their potential to deliver higher dividends to offset inflation. Of the 14 REITs in the screen, it's difficult to recommend any individual REIT. So instead I am posting the Vanguard Real Estate ETF, VNQ, which I own personally. 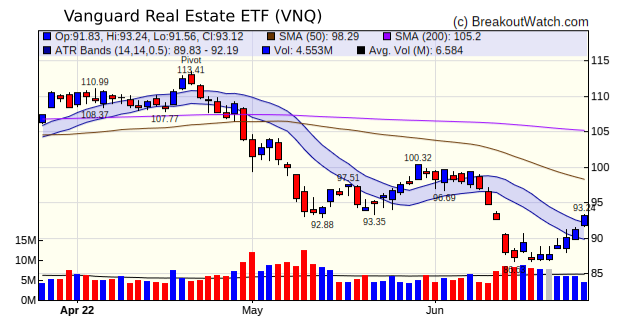 |
| No new features this week |
|
Our latest strategy
suggestions are here.
|
| List | Breakouts | Avg. Gain |
|---|---|---|
| CWH | 5 | 4.79 |
| SQZ | 26 | 2.61 |
| HTF | 0 | |
| HSB | 0 | |
| DB | 0 |
| Brkout Date | Symbol | Base | Squeeze | Brkout Price | Brkout Day Close | RS Rank* | Last Close | Current % off BOP | Gain at Intraday High |
|---|---|---|---|---|---|---|---|---|---|
| 2022-06-21 | UFCS | CWH | n | 33.49 | 34.33 | 96 | 37.12 | 10.84% | 11.26% |
| 2022-06-23 | TMDX | SQZ | y | 28.99 | 31.9 | 95 | 31.3 | 7.97% | 12.83% |
| 2022-06-21 | QUIK | CWH | n | 7.97 | 8.5 | 98 | 8.54 | 7.15% | 10.66% |
| 2022-06-23 | CORT | SQZ | y | 22.35 | 23.25 | 90 | 23.8 | 6.49% | 6.62% |
| 2022-06-23 | DRE | SQZ | y | 54.05 | 55.47 | 81 | 57.45 | 6.29% | 6.66% |
| 2022-06-23 | IONS | SQZ | y | 37.25 | 39.02 | 92 | 39.25 | 5.37% | 6.04% |
| *RS Rank on day before breakout. | |||||||||
| Symbol | Company | Industry | RS Rank | Last Close | BoP | % off BoP |
|---|---|---|---|---|---|---|
| SRLP | Sprague Resources LP | Oil & Gas Refining & Marketing | 94 | 18.95 | 19.03 | 99.58 |
| JILL | J. Jill, Inc. | Apparel Retail | 95 | 18.83 | 19.47 | 96.71 |
| CVBF | CVB Financial Corporation | Banks - Regional | 95 | 24.76 | 25.22 | 98.18 |
| *These stocks were selected using our CWH price breakout model. This model selects stocks likely to close above the breakout price at the next session. When backtested over the three years beginning January 2019 until October 28, 2021, 80% of the stocks selected closed above their breakout price. This does not mean that on any day, 80% of the stocks selected will breakout, but it is the expectation over an extended period of time. | ||||||
| Symbol | BO Price |
BO Vol. |
Company | Industry | RS Rank |
Last Close |
|---|---|---|---|---|---|---|
| TCDA | 11.38 | 806,493 | Tricida - Inc. | Drug Manufacturers - Specialty & Generic | 98 | 9.66 |
| CTT | 12.39 | 833,847 | CatchMark Timber Trust - Inc. | REIT - Specialty | 94 | 10.35 |
| VRRM | 16.73 | 1,476,984 | Verra Mobility Corporation | Security & Protection Services | 89 | 15.77 |
| These stocks meet our suggested screening factors
for our Cup and Handle Chart Pattern watchlist. See Revised Rules for Trading Cup and Handle Breakouts |
||||||
| Index | Value | Change Week | Change YTD | Trend1 |
|---|---|---|---|---|
| Dow | 31500.7 |
5.39% | -13.31% | Down |
| NASDAQ | 11607.6 |
7.49% | -25.81% | Down |
| S&P 500 | 3911.74 |
6.45% | -17.93% | Down |
|
1The Market Trend is derived from
our proprietary market model. The market model is described on
the site here.
2The site also shows industry rankings based on fundamentals, combined technical and fundamentals, and on price alone. The site also shows daily industry movements. |
||||
| 1 Week | 13 Weeks | 26 Weeks | Year-to-Date |
|---|---|---|---|
| NASDAQ Composite |
Dow Jones -9.64 |
Dow Jones -13.23 |
Dow Jones -13.31 |
| 1 Week | 3 Weeks | 13 Weeks | 26 Weeks |
|---|---|---|---|
| Oil & Gas Integrated |
Thermal Coal |
REIT - Residential |
Luxury Goods |
| Aerospace & Defense 0 |
Aerospace & Defense 0 |
Aerospace & Defense 0 |
Aerospace & Defense 0 |
| Charts of each industry rank and performance over 12 months are available on the site | |||
If you received this newsletter from a friend and you would like to receive it regularly please go to the BreakoutWatch.com site and you will then be able to register to receive the newsletter.
Copyright (c) 06/25/2022 Proactive Technologies, LLC dba
BreakoutWatch.com. All rights reserved.
" BreakoutWatch," the BreakoutWatch.com "eye" logo, and the slogan
"tomorrow's breakouts today" are service marks of Proactive Technologies
LLC. All other marks are the property of their respective owners, and
are used for descriptive purposes only.
BreakoutWatch is not affiliated with Investor's Business Daily or with Mr. William O'Neil. Our site, research and analysis is supported entirely by subscription and is free from advertising.