Breakoutwatch Weekly Summary 10/01/22
You are receiving this email because you are or were a
BreakoutWatch.com subscriber, or have subscribed to our weekly
newsletter. This newsletter summarizes the breakout events of the week
and provides additional guidance that does not fit into our daily
format. It is published each weekend.
Newsletter Archive: https://www.breakoutwatch.com/content/newsletters
| NASDAQ Testing June Low but Support
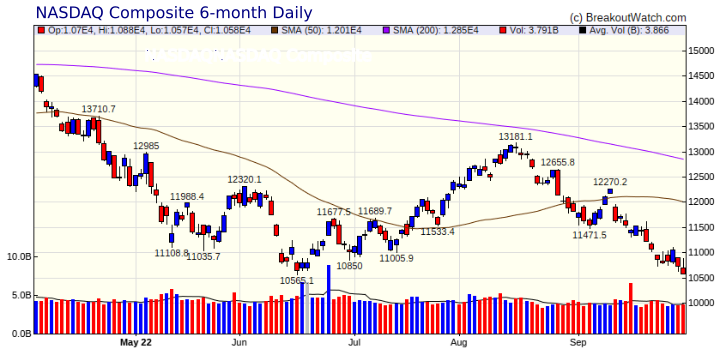
Unlikely I'm back from 4 weeks in Europe. If you tried to contact me and I didn't reply, please try again now. The NASDAQ has fallen to the support level last seen on June 16th which was followed by a 2 month recovery. On June 16th, the index closed above its low for the day, but that was not the case yesterday. So support at this level is unlikely. September was a bleak month with the NASDAQ losing 10.5%. Apple, one of the NASDAQ's tech leaders, dropped 8.1% this week on fears that sales of the new iPhone would tumble. As a result supplier's stocks also fell as well as funds and ETF's that have Apple as a core holding. Other factors weighing down the markets are:
 |
Navient
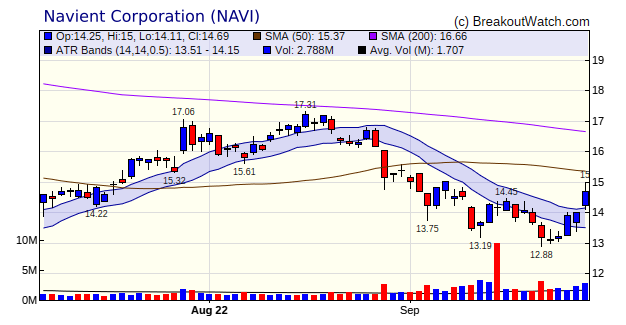
Corporation (NAVI) moved 5% higher on Friday and brokeout
from its Average True Range. The stock has shown increasing
positive volume for the last three days. The stock may have
benefited from changes announced Thursday on the
Administration's Student Loan forgiveness program.
The company has a dividend yield of 4.35%. Currently, NAVI's
payout ratio is 28% of earnings.
 |
| No new features this week |
|
Our latest strategy
suggestions are here.
|
| List | Breakouts | Avg. Gain |
|---|---|---|
| CWH | 2 | 3.1 |
| SQZ | 12 | 1.2 |
| HTF | 1 | 14.53 |
| HSB | 0 | |
| DB | 0 |
| Brkout Date | Symbol | Base | Squeeze | Brkout Price | Brkout Day Close | RS Rank* | Last Close | Current % off BOP | Gain at Intraday High |
|---|---|---|---|---|---|---|---|---|---|
| 2022-09-29 | AKRO | HTF | n | 29.73 | 29.8 | 99 | 34.05 | 14.53% | 18.84% |
| 2022-09-28 | KNSA | SQZ | y | 11.52 | 11.97 | 91 | 12.84 | 11.46% | 13.15% |
| 2022-09-28 | HLIT | CWH | n | 12.09 | 13 | 96 | 13.07 | 8.11% | 10.01% |
| *RS Rank on day before breakout. | |||||||||
| Symbol | Company | Industry | RS Rank | Last Close | BoP | % off BoP |
|---|---|---|---|---|---|---|
| There were no stocks meeting our probable breakout criteria today. | ||||||
| *These stocks were selected using our CWH price breakout model. This model selects stocks likely to close above the breakout price at the next session. When backtested over the three years beginning January 2019 until October 28, 2021, 80% of the stocks selected closed above their breakout price. This does not mean that on any day, 80% of the stocks selected will breakout, but it is the expectation over an extended period of time. | ||||||
| Symbol | BO Price |
BO Vol. |
Company | Industry | RS Rank |
Last Close |
|---|---|---|---|---|---|---|
| MOD | 17.52 | 541,730 | Modine Manufacturing Company | Auto Parts | 95 | 12.94 |
| MGI | 10.54 | 737,049 | Moneygram International - Inc. | Credit Services | 93 | 10.40 |
| TBPH | 11.00 | 904,612 | Theravance Biopharma - Inc. | Biotechnology | 92 | 10.14 |
| These stocks meet our suggested screening factors
for our Cup and Handle Chart Pattern watchlist. See Revised Rules for Trading Cup and Handle Breakouts |
||||||
| Index | Value | Change Week | Change YTD | Trend1 |
|---|---|---|---|---|
| Dow | 28725.5 |
-2.92% | -20.95% | Down |
| NASDAQ | 10575.6 |
-2.69% | -32.4% | Down |
| S&P 500 | 3585.62 |
-2.91% | -24.77% | Down |
|
1The Market Trend is derived from
our proprietary market model. The market model is described on
the site here.
2The site also shows industry rankings based on fundamentals, combined technical and fundamentals, and on price alone. The site also shows daily industry movements. |
||||
| 1 Week | 13 Weeks | 26 Weeks | Year-to-Date |
|---|---|---|---|
| NASDAQ Composite |
NASDAQ Composite -7.63 |
Dow Jones -17.5 |
Dow Jones -20.95 |
| 1 Week | 3 Weeks | 13 Weeks | 26 Weeks |
|---|---|---|---|
| Healthcare Plans |
Thermal Coal |
Thermal Coal |
Rental & Leasing Services |
| Aerospace & Defense 0 |
Aerospace & Defense 0 |
Aerospace & Defense 0 |
Aerospace & Defense 0 |
| Charts of each industry rank and performance over 12 months are available on the site | |||
If you received this newsletter from a friend and you would like to receive it regularly please go to the BreakoutWatch.com site and you will then be able to register to receive the newsletter.
Copyright (c) 10/01/2022 Proactive Technologies, LLC dba
BreakoutWatch.com. All rights reserved.
" BreakoutWatch," the BreakoutWatch.com "eye" logo, and the slogan
"tomorrow's breakouts today" are service marks of Proactive Technologies
LLC. All other marks are the property of their respective owners, and
are used for descriptive purposes only.
BreakoutWatch is not affiliated with Investor's Business Daily or with Mr. William O'Neil. Our site, research and analysis is supported entirely by subscription and is free from advertising.