Breakoutwatch Weekly Summary 10/22/22
You are receiving this email because you are or were a
BreakoutWatch.com subscriber, or have subscribed to our weekly
newsletter. This newsletter summarizes the breakout events of the week
and provides additional guidance that does not fit into our daily
format. It is published each weekend.
Newsletter Archive: https://www.breakoutwatch.com/content/newsletters
| NASDAQ Gains 3%: Have we Seen the
Bottom? This was a good week for stocks although the NASDAQ (3% gain) lagged the S&P 500 (3.9%) and DJI (6.4%). The chart below shows that the recent trend is to move sideways, which could be signs of the beginning of bottoming process. Most of the week's gains came on Friday in response to rumors that the Fed may start slowing the rate of interest rate increase after the next 75 basis point increase.This followed three days of falling prices as the 10 year treasury yield climbed to 4.25% while the Fed funds rate is at 3.0-3.25% offering a premium of 1%. It is expected that the Fed Funds rate could max out at 5% by May of next year by which time the 10year Treasury yield could be at 6% offering a substantial premium over the 1.8% yield of the S&P 500. In short, there is evidence that stocks could fall further as bonds offer a higher return than stocks. 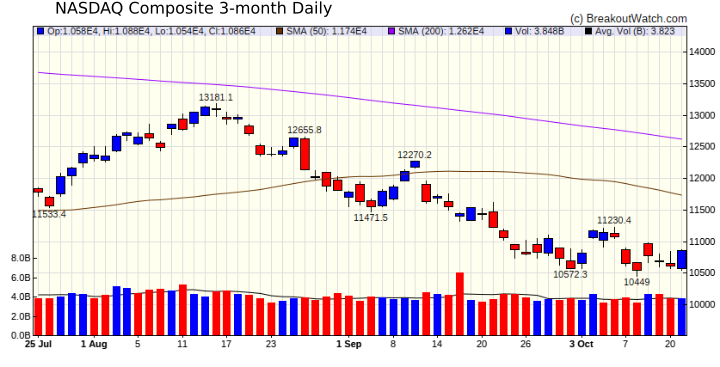 This was also a good week for breakouts with 16 gaining at least 5% and the average return of all breakouts being 3.2%. |
| APA Corporation
(APA) APA Corporation gained 4% in regular trading on Friday and a further 1% after hours despite going ex-dividend on Thursday and is just 1% below its pivot price. There is 15% possible upside after breakout to the left cup price. APA Corporation, through its subsidiaries, explores for, develops, and produces oil and gas properties. It has operations in the United States, Egypt, and the United Kingdom, as well as has exploration activities offshore Suriname. The company also operates gathering, processing, and transmission assets in West Texas, as well as holds ownership in four Permian-to-Gulf Coast pipelines. APA Corporation was founded in 1954 and is based in Houston, Texas. 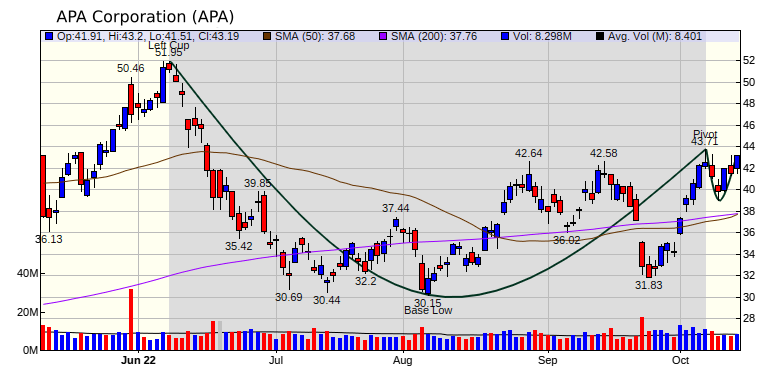 |
| No new features this week |
|
Our latest strategy
suggestions are here.
|
| List | Breakouts | Avg. Gain |
|---|---|---|
| CWH | 24 | 3.37 |
| SQZ | 43 | 3.06 |
| HTF | 0 | |
| HSB | 0 | |
| DB | 0 |
| Brkout Date | Symbol | Base | Squeeze | Brkout Price | Brkout Day Close | RS Rank* | Last Close | Current % off BOP | Gain at Intraday High |
|---|---|---|---|---|---|---|---|---|---|
| 2022-10-18 | EPAC | CWH | n | 21.05 | 22.6 | 85 | 24.19 | 14.92% | 15.53% |
| 2022-10-18 | WMK | SQZ | y | 76.95 | 82.93 | 91 | 87.97 | 14.32% | 15.39% |
| 2022-10-19 | NOV | CWH | n | 19.27 | 19.58 | 90 | 21.66 | 12.4% | 13% |
| 2022-10-18 | BELFB | SQZ | y | 26.35 | 27.65 | 98 | 29.12 | 10.51% | 11.65% |
| 2022-10-18 | DECK | SQZ | y | 331.21 | 361.07 | 91 | 363.28 | 9.68% | 10.33% |
| 2022-10-18 | CHCO | CWH | n | 91.84 | 94.62 | 91 | 100.67 | 9.61% | 9.81% |
| 2022-10-18 | UFCS | SQZ | y | 30.00 | 32.21 | 88 | 32.74 | 9.13% | 9.93% |
| 2022-10-19 | PBR | CWH | n | 14.75 | 14.87 | 92 | 16.05 | 8.81% | 10.64% |
| 2022-10-18 | BMI | SQZ | y | 93.48 | 96.97 | 86 | 101.52 | 8.6% | 8.64% |
| 2022-10-21 | SRCE | CWH | n | 51.85 | 55.89 | 88 | 55.89 | 7.79% | 7.87% |
| 2022-10-18 | CECE | SQZ | y | 9.76 | 10.46 | 98 | 10.5 | 7.58% | 9.84% |
| 2022-10-18 | SPTN | SQZ | y | 31.25 | 32.38 | 91 | 33.42 | 6.94% | 7.74% |
| 2022-10-18 | CAH | SQZ | y | 68.79 | 70.66 | 95 | 73.03 | 6.16% | 6.37% |
| 2022-10-21 | AMOT | SQZ | y | 29.80 | 31.46 | 86 | 31.46 | 5.57% | 5.67% |
| 2022-10-18 | ULH | SQZ | y | 32.86 | 34.73 | 97 | 34.6 | 5.3% | 8.09% |
| 2022-10-19 | IMKTA | SQZ | y | 85.57 | 87.55 | 83 | 90.07 | 5.26% | 6.25% |
| *RS Rank on day before breakout. | |||||||||
| Symbol | Company | Industry | RS Rank | Last Close | BoP | % off BoP |
|---|---|---|---|---|---|---|
| APA | APA Corporation | Oil & Gas E&P | 95 | 43.19 | 43.71 | 98.81 |
| FGEN | FibroGen, Inc | Biotechnology | 96 | 16.4 | 17.52 | 93.61 |
| DECK | Deckers Outdoor Corporation | Footwear & Accessories | 91 | 363.28 | 365.43 | 99.41 |
| CECE | CECO Environmental Corp. | Pollution & Treatment Controls | 98 | 10.5 | 10.72 | 97.95 |
| NBIX | Neurocrine Biosciences, Inc. | Biotechnology | 92 | 110.94 | 113.63 | 97.63 |
| RMBS | Rambus, Inc. | Semiconductors | 92 | 28.49 | 28.75 | 99.1 |
| BKE | Buckle, Inc. | Apparel Retail | 87 | 36.22 | 36.50 | 99.23 |
| SYBT | Stock Yards Bancorp, Inc. | Banks - Regional | 92 | 72.13 | 73.85 | 97.67 |
| SPFI | South Plains Financial, Inc. | Banks - Regional | 92 | 29.73 | 30.23 | 98.35 |
| UCBI | United Community Banks, Inc. | Banks - Regional | 88 | 36.17 | 37.60 | 96.2 |
| ORLY | O'Reilly Automotive, Inc. | Specialty Retail | 89 | 744.07 | 748.39 | 99.42 |
| ACRS | Aclaris Therapeutics, Inc. | Biotechnology | 92 | 16.58 | 17.14 | 96.73 |
| HWKN | Hawkins, Inc. | Specialty Chemicals | 89 | 41.34 | 42.08 | 98.24 |
| MGI | Moneygram International, Inc. | Credit Services | 91 | 10.53 | 10.60 | 99.34 |
| TXRH | Texas Roadhouse, Inc. | Restaurants | 90 | 95.46 | 96.98 | 98.43 |
| *These stocks were selected using our CWH price breakout model. This model selects stocks likely to close above the breakout price at the next session. When backtested over the three years beginning January 2019 until October 28, 2021, 80% of the stocks selected closed above their breakout price. This does not mean that on any day, 80% of the stocks selected will breakout, but it is the expectation over an extended period of time. | ||||||
| Symbol | BO Price |
BO Vol. |
Company | Industry | RS Rank |
Last Close |
|---|---|---|---|---|---|---|
| WTI | 7.99 | 6,124,394 | W&T Offshore - Inc. | Oil & Gas E&P | 98 | 7.47 |
| IMGN | 6.47 | 4,552,434 | ImmunoGen - Inc. | Biotechnology | 91 | 6.14 |
| AMBC | 15.36 | 730,355 | Ambac Financial Group - Inc. | Insurance - Specialty | 90 | 13.30 |
| TBPH | 11.00 | 894,761 | Theravance Biopharma - Inc. | Biotechnology | 89 | 9.84 |
| FULT | 17.85 | 1,323,305 | Fulton Financial Corporation | Banks - Regional | 85 | 17.24 |
| These stocks meet our suggested screening factors
for our Cup and Handle Chart Pattern watchlist. See Revised Rules for Trading Cup and Handle Breakouts |
||||||
| Index | Value | Change Week | Change YTD | Trend1 |
|---|---|---|---|---|
| Dow | 31082.6 |
6.44% | -14.46% | Down |
| NASDAQ | 10859.7 |
3.01% | -30.59% | Down |
| S&P 500 | 3752.75 |
3.89% | -21.26% | Down |
|
1The Market Trend is derived from
our proprietary market model. The market model is described on
the site here.
2The site also shows industry rankings based on fundamentals, combined technical and fundamentals, and on price alone. The site also shows daily industry movements. |
||||
| 1 Week | 13 Weeks | 26 Weeks | Year-to-Date |
|---|---|---|---|
| Dow Jones |
Dow Jones -2.56 |
Dow Jones -8.07 |
Dow Jones -14.46 |
| 1 Week | 3 Weeks | 13 Weeks | 26 Weeks |
|---|---|---|---|
| Thermal Coal |
Thermal Coal |
Thermal Coal |
Industrial Distribution |
| Aerospace & Defense 0 |
Aerospace & Defense 0 |
Aerospace & Defense 0 |
Aerospace & Defense 0 |
| Charts of each industry rank and performance over 12 months are available on the site | |||
If you received this newsletter from a friend and you would like to receive it regularly please go to the BreakoutWatch.com site and you will then be able to register to receive the newsletter.
Copyright (c) 10/22/2022 Proactive Technologies, LLC dba
BreakoutWatch.com. All rights reserved.
" BreakoutWatch," the BreakoutWatch.com "eye" logo, and the slogan
"tomorrow's breakouts today" are service marks of Proactive Technologies
LLC. All other marks are the property of their respective owners, and
are used for descriptive purposes only.
BreakoutWatch is not affiliated with Investor's Business Daily or with Mr. William O'Neil. Our site, research and analysis is supported entirely by subscription and is free from advertising.