Breakoutwatch Weekly Summary 10/29/22
You are receiving this email because you are or were a
BreakoutWatch.com subscriber, or have subscribed to our weekly
newsletter. This newsletter summarizes the breakout events of the week
and provides additional guidance that does not fit into our daily
format. It is published each weekend.
Newsletter Archive: https://www.breakoutwatch.com/content/newsletters
| A Strong Week for Breakouts with 33
Gaining > 5%; Industrials Preferred over Technology Market Trends are positive for the DJI and S&P 500 while the NASDAQ trend remains Down. Usually we focus on the NASDAQ Composite chart because historically that's where the majority of breakouts come from. This week though we also present charts of the DJI and S&P 500 which show that the NASDAQ is trending sideways while the other 2 are trending up. This indicates that even though mega cap stocks are heavily weighted in all three indexes, market participants are preferring other industry sectors. Strongest performing sectors were industrials (+6.7%), utilities (+6.5%), financials (+6.2%), and real estate (+6.2%) (Briefing.com). When anticipating which stocks on our watchlists are likely to breakout, then we should look away from the technology sector. 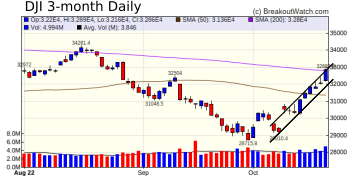 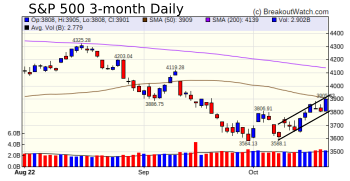 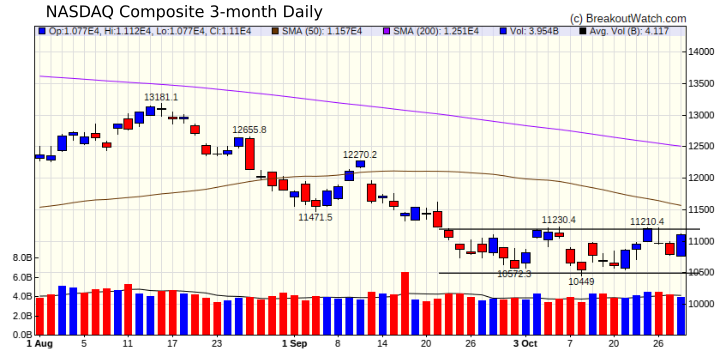 |
| Lindsay
Corporation (LNN) Lindsay Corporation operates in the Farm & Heavy Construction Machinery component of the Industrial s sector. As noted above, industrials is one of the strongest performing sectors currently. The handle shows consolidation followed by accumulation and closed near its breakout point on Friday on volume nearly 2 times the average. 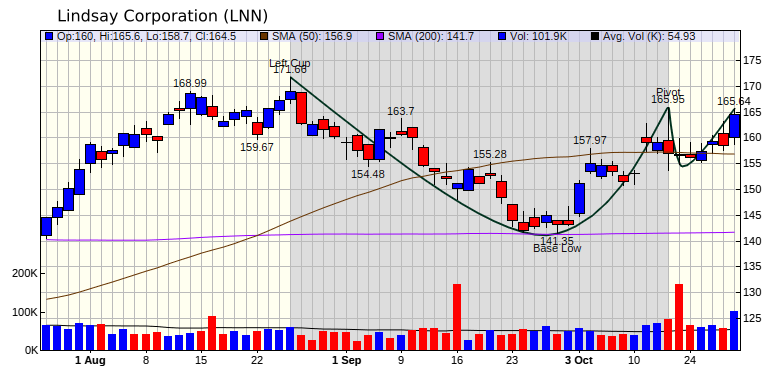 |
| No new features this week |
|
Our latest strategy
suggestions are here.
|
| List | Breakouts | Avg. Gain |
|---|---|---|
| CWH | 27 | 4.13 |
| SQZ | 69 | 3.92 |
| HTF | 0 | |
| HSB | 0 | |
| DB | 0 |
| Brkout Date | Symbol | Base | Squeeze | Brkout Price | Brkout Day Close | RS Rank* | Last Close | Current % off BOP | Gain at Intraday High |
|---|---|---|---|---|---|---|---|---|---|
| 2022-10-25 | ATNM | SQZ | y | 7.30 | 7.92 | 94 | 9.73 | 33.29% | 37.66% |
| 2022-10-26 | ATNM | SQZ | y | 7.93 | 8.69 | 95 | 9.73 | 22.7% | 26.73% |
| 2022-10-25 | CALX | SQZ | y | 60.35 | 71.4 | 95 | 73.12 | 21.16% | 25.04% |
| 2022-10-24 | ORLY | CWH | n | 748.39 | 768.46 | 89 | 836.3 | 11.75% | 12.12% |
| 2022-10-25 | LEU | SQZ | y | 42.30 | 43.37 | 95 | 47.06 | 11.25% | 11.25% |
| 2022-10-25 | BIOX | SQZ | y | 13.06 | 13.78 | 91 | 14.48 | 10.87% | 10.95% |
| 2022-10-24 | BKE | CWH | n | 36.50 | 36.89 | 87 | 40.44 | 10.79% | 11.07% |
| 2022-10-24 | TTC | CWH | n | 96.77 | 98.35 | 88 | 106.84 | 10.41% | 11.36% |
| 2022-10-24 | CECE | CWH | n | 10.72 | 11.51 | 98 | 11.82 | 10.26% | 11.94% |
| 2022-10-26 | PGNY | SQZ | y | 40.01 | 41.13 | 83 | 44.01 | 10% | 10.96% |
| 2022-10-27 | CCB | SQZ | y | 41.39 | 42.33 | 82 | 45.48 | 9.88% | 9.93% |
| 2022-10-26 | TCBK | CWH | n | 52.10 | 53.02 | 91 | 57.11 | 9.62% | 9.85% |
| 2022-10-27 | BJRI | CWH | n | 29.82 | 30.22 | 86 | 32.59 | 9.29% | 9.62% |
| 2022-10-26 | TA | SQZ | y | 58.76 | 60.08 | 96 | 64.11 | 9.1% | 11.18% |
| 2022-10-26 | LEU | SQZ | y | 43.38 | 44.38 | 94 | 47.06 | 8.48% | 8.48% |
| 2022-10-27 | PGNY | SQZ | y | 41.14 | 41.35 | 86 | 44.01 | 6.98% | 7.91% |
| 2022-10-25 | ATGE | CWH | n | 39.10 | 40.93 | 89 | 41.81 | 6.93% | 8.01% |
| 2022-10-27 | RYTM | SQZ | y | 24.70 | 25.58 | 99 | 26.37 | 6.76% | 6.8% |
| 2022-10-24 | PGC | CWH | n | 36.88 | 37.01 | 90 | 39.37 | 6.75% | 6.97% |
| 2022-10-25 | JKHY | SQZ | y | 189.15 | 192.67 | 82 | 201.73 | 6.65% | 7.14% |
| 2022-10-26 | KRYS | SQZ | y | 73.02 | 74.47 | 90 | 77.78 | 6.52% | 7.05% |
| 2022-10-25 | DLTR | SQZ | y | 149.01 | 153.9 | 85 | 158.55 | 6.4% | 6.99% |
| 2022-10-24 | BMY | SQZ | y | 72.22 | 72.99 | 86 | 76.83 | 6.38% | 6.56% |
| 2022-10-25 | DG | SQZ | y | 244.99 | 250.46 | 85 | 260.44 | 6.31% | 6.78% |
| 2022-10-26 | PGR | SQZ | y | 122.12 | 122.93 | 89 | 129.7 | 6.21% | 6.37% |
| 2022-10-25 | OXM | SQZ | y | 94.70 | 96.72 | 83 | 100.45 | 6.07% | 6.17% |
| 2022-10-27 | BRP | SQZ | y | 27.58 | 27.73 | 81 | 29.23 | 5.98% | 6.06% |
| 2022-10-24 | CPRX | SQZ | y | 13.42 | 14 | 98 | 14.19 | 5.74% | 9.58% |
| 2022-10-25 | NL | SQZ | y | 8.26 | 8.47 | 90 | 8.73 | 5.69% | 8.11% |
| 2022-10-26 | BMY | SQZ | y | 72.78 | 74.45 | 86 | 76.83 | 5.56% | 5.74% |
| 2022-10-28 | BRP | SQZ | y | 27.74 | 29.23 | 81 | 29.23 | 5.37% | 5.44% |
| 2022-10-26 | HAYN | CWH | n | 45.63 | 46.43 | 93 | 47.95 | 5.08% | 5.57% |
| 2022-10-26 | BIOX | SQZ | y | 13.79 | 14.2 | 93 | 14.48 | 5% | 5.08% |
| *RS Rank on day before breakout. | |||||||||
| Symbol | Company | Industry | RS Rank | Last Close | BoP | % off BoP |
|---|---|---|---|---|---|---|
| REGN | Regeneron Pharmaceuticals, Inc. | Biotechnology | 92 | 750.76 | 755.21 | 99.41 |
| JACK | Jack In The Box Inc. | Restaurants | 86 | 88.5 | 89.55 | 98.83 |
| AAWW | Atlas Air Worldwide Holdings | Airports & Air Services | 95 | 100.86 | 101.25 | 99.61 |
| HIBB | Hibbett, Inc. | Specialty Retail | 92 | 63.04 | 63.67 | 99.01 |
| GMAB | Genmab A/S | Biotechnology | 85 | 39.09 | 39.40 | 99.21 |
| AVXL | Anavex Life Sciences Corp. | Biotechnology | 85 | 12.26 | 13.34 | 91.9 |
| PERI | Perion Network Ltd | Internet Content & Information | 88 | 23.5 | 24.18 | 97.19 |
| TMDX | TransMedics Group, Inc. | Medical Devices | 98 | 48.66 | 50.36 | 96.62 |
| SJI | South Jersey Industries, Inc. | Utilities - Diversified | 91 | 34.9 | 34.99 | 99.74 |
| SSB | SouthState Corporation | Banks - Regional | 87 | 89.96 | 91.74 | 98.06 |
| GRIN | Grindrod Shipping Holdings Ltd. | Marine Shipping | 96 | 25.88 | 26.00 | 99.54 |
| CORT | Corcept Therapeutics Inco | Biotechnology | 94 | 28.44 | 29.27 | 97.16 |
| ATEC | Alphatec Holdings, Inc. | Medical Devices | 87 | 10.25 | 10.90 | 94.04 |
| APEN | Apollo Endosurgery, Inc. | Medical Devices | 82 | 6.27 | 6.66 | 94.14 |
| CHEF | The Chefs' Warehouse, Inc. | Food Distribution | 85 | 36.5 | 37.34 | 97.75 |
| *These stocks were selected using our CWH price breakout model. This model selects stocks likely to close above the breakout price at the next session. When backtested over the three years beginning January 2019 until October 28, 2021, 80% of the stocks selected closed above their breakout price. This does not mean that on any day, 80% of the stocks selected will breakout, but it is the expectation over an extended period of time. | ||||||
| Symbol | BO Price |
BO Vol. |
Company | Industry | RS Rank |
Last Close |
|---|---|---|---|---|---|---|
| WTI | 8.32 | 5,740,363 | W&T Offshore - Inc. | Oil & Gas E&P | 97 | 7.34 |
| ADT | 8.91 | 5,631,876 | ADT Inc. | Security & Protection Services | 90 | 8.70 |
| MGI | 10.62 | 778,569 | Moneygram International - Inc. | Credit Services | 90 | 10.55 |
| AMBC | 15.36 | 635,111 | Ambac Financial Group - Inc. | Insurance - Specialty | 89 | 13.66 |
| IMGN | 6.47 | 4,518,693 | ImmunoGen - Inc. | Biotechnology | 89 | 6.06 |
| TTMI | 15.76 | 790,998 | TTM Technologies - Inc. | Electronic Components | 89 | 15.35 |
| TBPH | 11.00 | 878,246 | Theravance Biopharma - Inc. | Biotechnology | 88 | 9.99 |
| KURA | 17.27 | 1,251,162 | Kura Oncology - Inc. | Biotechnology | 83 | 15.90 |
| These stocks meet our suggested screening factors
for our Cup and Handle Chart Pattern watchlist. See Revised Rules for Trading Cup and Handle Breakouts |
||||||
| Index | Value | Change Week | Change YTD | Trend1 |
|---|---|---|---|---|
| Dow | 32861.8 |
5.72% | -9.57% | Up |
| NASDAQ | 11102.5 |
2.24% | -29.03% | Down |
| S&P 500 | 3901.06 |
3.95% | -18.15% | Up |
|
1The Market Trend is derived from
our proprietary market model. The market model is described on
the site here.
2The site also shows industry rankings based on fundamentals, combined technical and fundamentals, and on price alone. The site also shows daily industry movements. |
||||
| 1 Week | 13 Weeks | 26 Weeks | Year-to-Date |
|---|---|---|---|
| Dow Jones |
Dow Jones 0.05 |
Dow Jones -0.35 |
Dow Jones -9.57 |
| 1 Week | 3 Weeks | 13 Weeks | 26 Weeks |
|---|---|---|---|
| Thermal Coal |
Healthcare Plans |
Thermal Coal |
Thermal Coal |
| Aerospace & Defense 0 |
Aerospace & Defense 0 |
Aerospace & Defense 0 |
Aerospace & Defense 0 |
| Charts of each industry rank and performance over 12 months are available on the site | |||
If you received this newsletter from a friend and you would like to receive it regularly please go to the BreakoutWatch.com site and you will then be able to register to receive the newsletter.
Copyright (c) 10/29/2022 Proactive Technologies, LLC dba
BreakoutWatch.com. All rights reserved.
" BreakoutWatch," the BreakoutWatch.com "eye" logo, and the slogan
"tomorrow's breakouts today" are service marks of Proactive Technologies
LLC. All other marks are the property of their respective owners, and
are used for descriptive purposes only.
BreakoutWatch is not affiliated with Investor's Business Daily or with Mr. William O'Neil. Our site, research and analysis is supported entirely by subscription and is free from advertising.