During 2017, the daily trading range of the S&P 500 was around 2%. I found, through back testing of the cup-and-handle breakout stocks, that a trailing stop of 3% gave very good average returns during that time. However, now that volatility has increased sharply, a 3% trailing stop is likely to cause one to exit a position too soon and be sub-optimal as the stock could quickly rise again and what could have been a winning position has been turned into a losing one. Which leads to the question of what trailing stop value is appropriate in 2018?
Volatility, as the term implies, waxes and wanes. It not only applies to the major indexes but also to individual stocks. The optimum trailing stop value during high volatility will be looser than during a period of low volatility, and what is appropriate for one stock that is experiencing high volatility will not be optimum for another experiencing low volatility. What we need is a method for calculating a trailing stop value suitable to the volatility of each individual stock. I am proposing that the Average True Range indicator could be the tool we need.
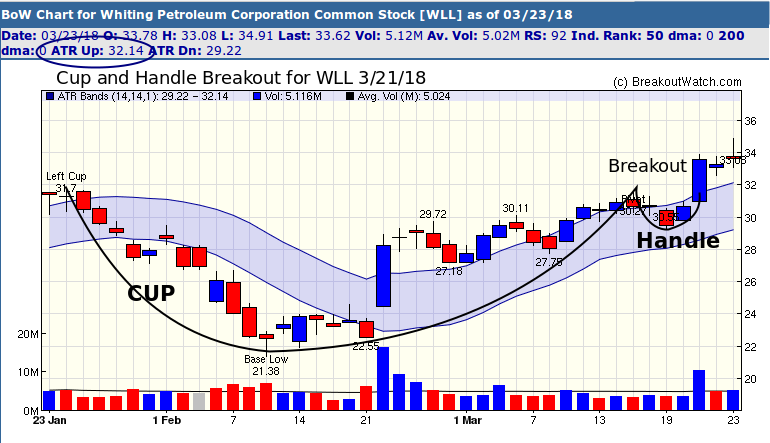
The true range concept was introduced by commodities trader Welles Wilder. I wont describe the calculation here as you can read about it in Wikipedia. The Average True Range (ATR) is a moving average calculated over 'n' days. For our calculation we are using n=14 days, although I may change that if I find a shorter period gives better results. I have added an ATR band to our technical charting tool. It is explained in this newsletter. Here's an example of applying the ATR band to Whiting Petroleum Corporation (WLL) which broke out on 3/21/2018. If we were to use the upper ATR band as a trailing stop for the next day's trading (3/26/18) then we use a value of 32.14 which is the value of the upper ATR band on 3/23/18.
As I remarked above, a 3% trailing stop worked well in the low volatility environment of 2017. But what value should we use now volatility has increased? The beauty of using ATR is that we don't have to guess as the ATR value is adjusted each day and for each stock. To illustrate this I ran the backtest for 2018 using parameters designed to include a large number of breakouts in the backtest for both the 2017 trailing stop value of 3% and for the upper ATR value as a trailing stop. The parameters for stock selection were identical in both cases.
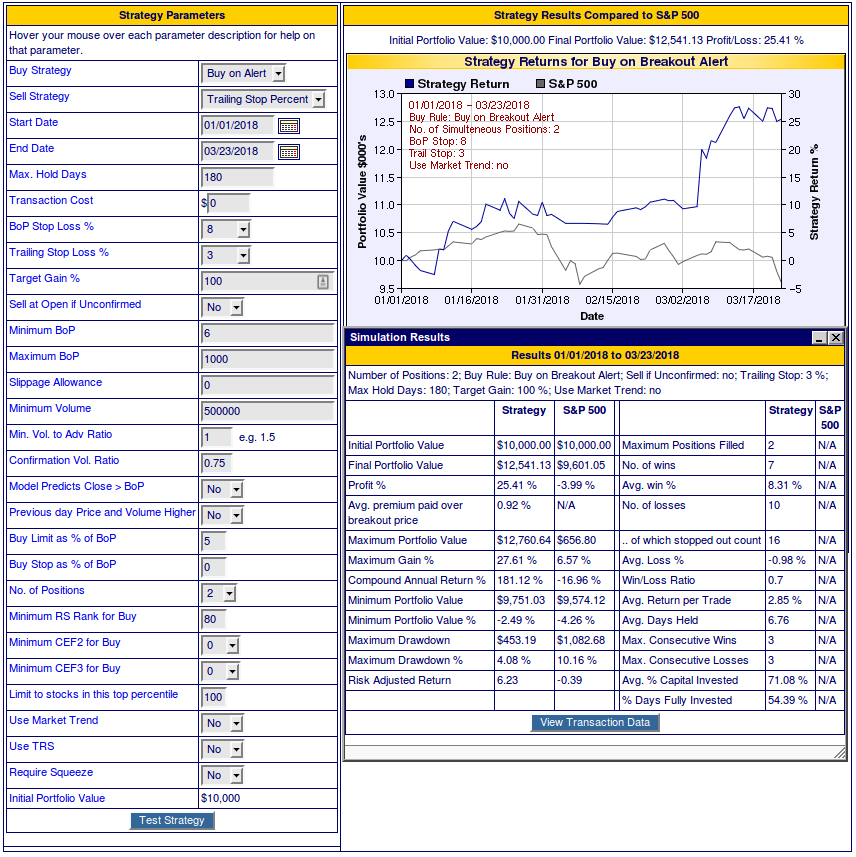
Backtest 2018 using 3% Trailing stop
For the period 01/01/2018 to 03/23/2018, the backtest gave a profit of 25.41% with 7 winning trades and 10 losing trades. The average win per winning trade was 8.31%
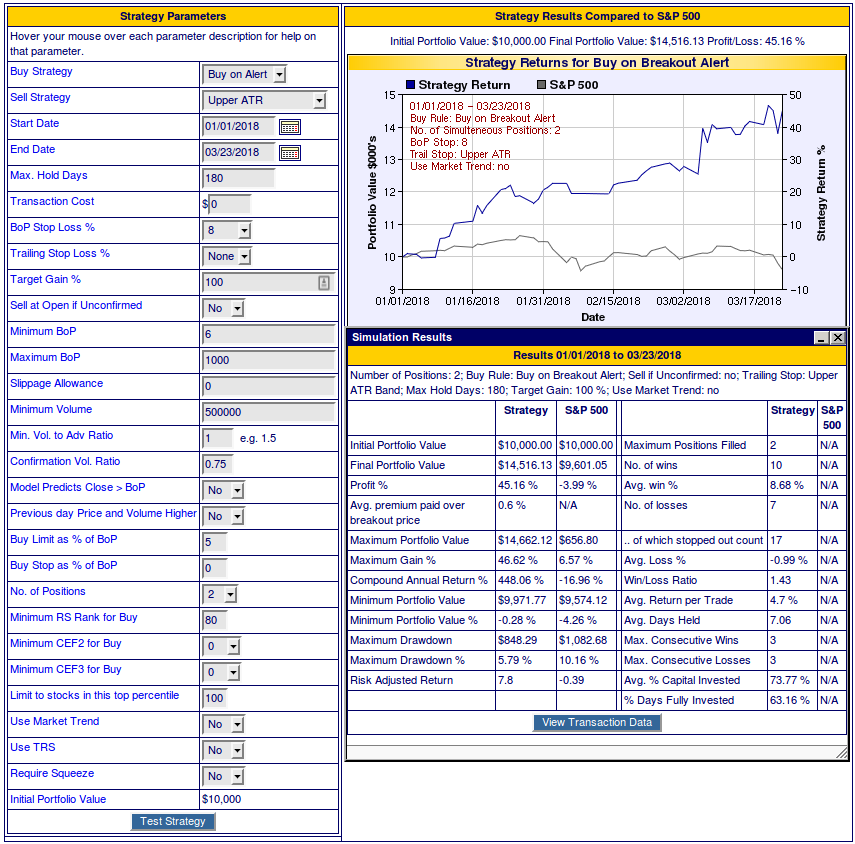
Backtest 2018 using Upper ATR Band
For the period 01/01/2018 to 03/23/2018, the backtest gave a profit of 45.16% with 10 winning trades and 7 losing trades. The average win per winning trade was 8.68%