| Market Summary | Weekly Breakout Report | Top Breakout Choices | Top 2nd Chances | New Features | Tip of the Week |
Breakoutwatch.com Reviewed in Stocks & Commodities Magazine
 Technical
Analysis of Stocks & Commodities magazine editor, Jayanthi Gopalakrishnan,
reviewed breakout watch.com for the June issue of the magazine. You can read
the review here.
Market Summary
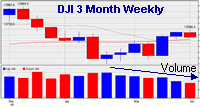
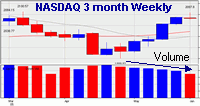
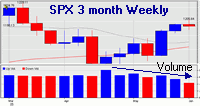
A series of conflicting economic numbers and rising oil prices introduced uncertainty into the markets this week with the result that sellers were in control by the end of the week and the markets lost ground. This was the first loss in three weeks for the DJI and S&P 500, which closed down 0.77% and 0.23% respectively, and the first loss in 5 weeks for the NASDAQ which closed down 0.21%. Despite this week's minor setback, the NASDAQ is still the most bullish of the indexes with accumulation exceeding distribution by the healthy margin of 11 accumulation days to just 3 distribution days since the current rally began on April 29. We noted last week that weekly volume has been trending downwards on the NASDAQ and that trend continued this week. The trend is also evident on the other indexes, as shown on the weekly charts below. We also noted last week that decreasing volume combined with rising prices could be a sign that the upward trend was weakening and that seems to have been confirmed this week. Until price and volume trends start moving in the same direction, we are likely to see predominantly sideways movement.
 |
 |
 |
In view of the increasing evidence of a slowdown in economic growth, the markets will be watching Federal Reserve Chairman Alan Greenspan's testimony to Congress on the economy next Thursday for signs that the Fed could change its policy stance on interest rates. Any indication that the Fed may not raise rates at its next Open Market Committee meeting on June 29-30 could give the markets a boost.
Breakouts
Breakouts continued to perform quite strongly with 43 being confirmed this week across a broad base of sectors. SIRF, which had attempted to breakout of a CwH pattern on 5/26, did so strongly on 6/1 and then gapped up on 6/2 to gain 17.2% over its pivot before slipping back to close for a 9.9% gain. OTTR broke out of a flat base on Monday and volume stayed well above average levels all week enabling the stock to gain 8.3% at Friday's close. RADS, which has gained nearly 100% since appearing on our CwH list in February, broke out of a 3 day handle on Wednesday to rise 9.8% before slipping back for an overall gain of 7.2%.
There were no breakdowns this week.
Industry Analysis
Healthcare-Hospitals continued to be the top performing industry as measured by our technical criteria, with Transportation-Equipment Manufacturers being the most improved, rising 64 points in the rankings to position 48 out of our 192 industry groups.
Get a 14 day Trial of our premium 'Platinum' service for just $9.95 and if you subsequently subscribe to any subscription level we will credit your $9.95 to your subscription. 14
Day Platinum Trial |
There were no new features added this week.
Technical Condition vs. Fundamental Condition Update
On 4/30/05 we reported in this newsletter that technical condition outweighed fundamental strength with breakouts from zone 4-3 outperforming zone 4-4 during 2005. (For an explanation of our zone methodology see here). I was asked to apply the same analysis to all stocks since April, 2003 when our current CwH algorithm was implemented, so here it is.
We analyzed all stocks that were on our CwH watchlist since April, 2003, counted the number of breakouts and assessed each breakout as a success, a failure or undetermined:
- to be successful, a breakout had to close for a gain of at least 5% over its pivot following the breakout
- to be a failure, a breakout had to fail to meet the success threshold, and then fall to an intraday low of 8% below the pivot (equivalent to assuming a 8% stop-loss order).
- to be undetermined, a stock had to remain within the range -8% to +5%.
- if successful, the gain following breakout was measured as the difference between the breakout price and the subsequent highest closing price.
- if a failure, the gain following breakout was set at -8%.
- if indeterminate, the gain was set at 0%.
- these gains were categorized within the ranges <8%, 0-5%, 5%-20%, 20%-50%, 50%-100%, >100%
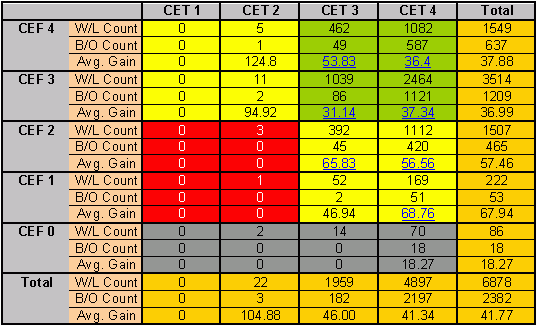
The results are summarized in the table below. To see how the distribution of gains was distributed for each zone, click on the Avg. Gain number for the zone (only available where the number of breakouts was significant - indicated by a value in blue underline).

|
W/L Count => Number of stocks on the CwH watchlist
in the zone. A stock is counted only once in each zone but can appear
in multiple zones. |
B/O Count => Number of breakouts from that zone. |
Observations
- There are no breakouts in the CET 1 column in part because we screen for a Relative Strength Rank >= 70 before placing a stock on our watchlists.
- The high return for breakouts in the CET 2 column and Zone 3-1 cannot be relied on, because of the small number (3) of observations.
- The average gain of breakouts in the CET 3 and CET 4 columns exceeds the average gain of breakouts in the CEF 3 and CEF 4 rows, confirming our earlier conclusion that technical strength is a better indication of subsequent breakout performance than fundamental strength.
- The methodology used here is more conservative than that used for the performance report on the site, so the results are not strictly comparable.
- The Zone with the least number of failures, and also giving the highest return, was Zone 4-1.
- The zone with the highest percentage of failures was Zone 3-3 with 31%. However, the relatively small number of breakouts in the CET 3 column, 182 compared to 2197 in the CET 4 column, makes any conclusions drawn from the CET 3 results suspect.
- 92% of breakouts came from stocks with CET Zone score of 4, whereas only 27% came from a CEF Zone score of 4.
Conclusion
Technical strength is a better predictor of likely breakouts than fundamental strength and strong technical strength stocks are likely to make stronger gains than strong fundamental strength stocks.
Get a 14 day Trial of our premium 'Platinum' service for just $9.95 and if you subsequently subscribe to any subscription level we will credit your $9.95 to your subscription. 14
Day Platinum Trial |
| Index | Value | Change Week | Change YTD | Market1 Signal |
||||||||||||||||||||||||||||||||||||
|---|---|---|---|---|---|---|---|---|---|---|---|---|---|---|---|---|---|---|---|---|---|---|---|---|---|---|---|---|---|---|---|---|---|---|---|---|---|---|---|---|
| Dow | 10461 | -0.77% | -2.99% | enter | ||||||||||||||||||||||||||||||||||||
| NASDAQ | 2071.43 | -0.21% | -4.78% | enter | ||||||||||||||||||||||||||||||||||||
| S&P 500 | 1196.02 | -0.23% | -1.31% | enter | ||||||||||||||||||||||||||||||||||||
1The Market Signal is derived from our proprietary
market model. The market model is described on the site. 2The site also shows industry rankings based on fundamentals, combined technical and fundamentals, and on price alone (similar to IBD). The site also shows daily industry movements. |
||||||||||||||||||||||||||||||||||||||||
# of Breakouts
|
Period Average1
|
Max. Gain During Period2
|
Gain at Period Close3
|
|
|---|---|---|---|---|
| This Week | 43 | 23.62 | 4.71% | 1.2% |
| Last Week | 35 | 23.85 | 7.82% | 3.48% |
| 13 Weeks | 370 | 27.15 | 9.41% |
2.62% |
Sector
|
Industry
|
Breakout Count for Week
|
|---|---|---|
Electronics
|
Electr-Semicndtr Mfg
|
3
|
Telecomm
|
Telecomm-Equipment
|
3
|
Computer
|
Computer-Integrated Sys
|
2
|
Computer Software
|
Comp Software-Enterprise
|
2
|
Insurance
|
Insurance-Prop/Casualty/TItl
|
2
|
Real Estate/ REIT
|
Real Estate-REIT
|
2
|
Retail
|
Retail-Apparel
|
2
|
Utility
|
Utility-Electric
|
2
|
Aerospace & Defense
|
Aerospace & Defense-Equip
|
1
|
Banks
|
Banks-Foreign
|
1
|
Building
|
Building-Residentl/Comml
|
1
|
Building
|
Building-Heavy Constr
|
1
|
Business Services
|
Business Svcs-Misc
|
1
|
Computer
|
Computer-Networking
|
1
|
Computer Software
|
Comp Software-Healthcare
|
1
|
Computer Software
|
Comp Software-Desktop
|
1
|
Electronics
|
Electr-Semicndtr Equip
|
1
|
Finance
|
Finance-Misc Services
|
1
|
Finance
|
Finance-Consumer Loans
|
1
|
Healthcare
|
Healthcare-Products
|
1
|
Healthcare
|
Healthcare-Instruments
|
1
|
Internet
|
Internet-E:Commerce
|
1
|
Leisure
|
Leisure-Products
|
1
|
Machinery
|
Machinery-Matl Hdlg/Autom
|
1
|
Machinery
|
Machinery-Const/Mining
|
1
|
Media
|
Media-Diversified
|
1
|
Oil & Gas
|
Oil & Gas-Prod/Pipeline
|
1
|
Pollution Control
|
Pollution Control-Services
|
1
|
Retail
|
Retail-Restaurant
|
1
|
Retail
|
Retail-Home Furnishings
|
1
|
Telecomm
|
Telecomm-Wireless Services
|
1
|
Textile
|
Textile-Apparel Mfg
|
1
|
Transportation
|
Transportation -Airlines
|
1
|
2This represents the return if each stock were bought at its breakout price and sold at its intraday high.
3This represents the return if each stock were bought at its breakout price and sold at the most recent close.
Category |
Symbol |
Company Name |
Expected Gain1 |
|---|---|---|---|
| Best Overall | HYC | HYPERCOM CORP | 110 |
| Top Technical | CCRD | CONCORD COMMUNICATIONS INC | 35 |
| Top Fundamental | CTGI | CAPITAL TITLE GROUP INC | 87 |
| Top Tech. & Fund. | CTGI | CAPITAL TITLE GROUP INC | 87 |
Category |
Symbol |
Company Name |
Expected Gain1 |
|---|---|---|---|
| Best Overall | ANTP | PHAZAR CORP | 101 |
| Top Technical | MTH | MERITAGE CORP | 41 |
| Top Fundamental | CRM | Salesforce.com Inc. | 68 |
| Top Tech. & Fund. | CRM | Salesforce.com Inc. | 68 |
If you received this newletter from a friend and you would like to receive it regularly please go to the BreakoutWatch.com site and enter as a Guest. You will then be able to register to receive the newsletter.
Copyright © 2005 NBIcharts, LLC dba BreakoutWatch.com. All rights reserved.