| Market Summary | Weekly Breakout Report | Top Breakout Choices | Top 2nd Chances | New Features | Tip of the Week |
Market Summary
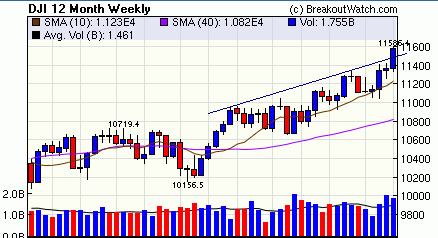
The markets moved higher this week as investors put their fear of further interest rate rises behind them as crude oil prices fell and there were signs that the economy is growing but at a slower pace. The DJI gained 1.85% for the week, set a new 6-year high on Friday and is within striking distance of a new all-time record. It broke through its trend resistance line and scored its fifth straight week of gains.

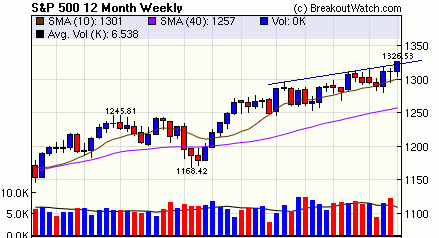
The S&P 500 gained 1.16% for the week and also broke through its trend resistance line (weekly volume was not available at the time of writing).

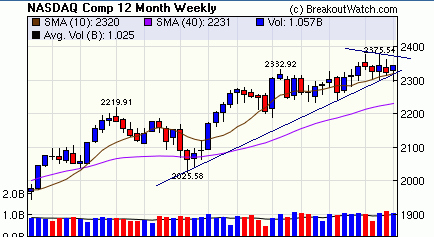
The NASDAQ Composite was the laggard with a gain of 0.86%. The index suffered a distribution day on Tuesday, avoiding by one day our market model issuing an exit signal. The index recovered from its trend support line after closing below its 50 day moving average on Tuesday and Wednesday. Thursday and Friday saw further gains but volume was insufficient to allow the index to record any accumulation days. The index may have come off life-support but is still not performing strongly despite its strong showing earlier in the year.

Whether or not the positive direction can be maintained for the markets will be determined on Wednesday when the next meeting of the Federal Reserve Open Markets Committee will deliver the results their deliberations. A further rate increase of 0.25% is expected but it will be accompanying statement that determines the market's mood.
The number of successful breakouts rose to 39 this week although their overall performance by week's end could only manage to equal that of the NASDAQ. The average breakout gains were weighed down by WEX which broke out on Monday and reached a high of 13.8% above its pivot before collapsing to a loss of 19.3% by week's end.
Sell Assistant
We are introducing some important changes to the Sell Assistant. Please read on.
Get a 14 day Trial of our premium 'Platinum' service for just $9.95 and if you subsequently subscribe to any subscription level we will credit your $9.95 to your subscription. 14
Day Platinum Trial |
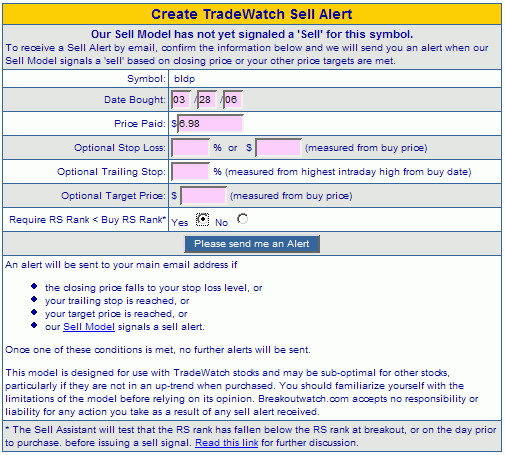
We've made several improvements to our Sell Assistant this week. The reasons for adding the RS Rank test is explained in this week's top tip below. The trailing stop was added to increase flexibility when using the Sell Assistant to protect gains following a suggesting from a subscriber.
-
You can choose whether or not to use our RS Rank test in making the sell decision. The default will now be to use the RS Rank test.
- You can apply a trailing stop percentage to the sell decision. In this case a sell signal will be issued if the close falls to or below the highest intraday high day reached since buy date by the trailing stop percentage.
- Using a stop loss of 8% is now the default.
The new Sell Assistant setup form looks like this and is self-explanatory:

You can also edit your existing alerts to apply the new features.
Letting Winners Run - Backtest Progress
Last week we showed that since the start of the year our Buy at Open strategy had picked several very strong performers but that our Sell Assistant was causing us to sell them too soon. We showed that if one ignored the Sell Assistant when the RS rank was still at or above the RS rank at breakout, then the big winners would be allowed to keep running to provide some very spectacular gains. You can read last weeks analysis here which shows the results for 2006.
We have now completed backtesting that theory against Buy at Open stocks back to April, 2003, the earliest date for which we have consistent data. For comparison purposes we show the change in the S&P 500 over the same periods. Here are the results:
| Year | S&P Gain | Test | Average Gain | Average Hold Days |
Annualized Return |
|---|---|---|---|---|---|
| 2003 | 31.1% | Without RS Test | 19.5% | 56.2 | 126.6% |
| With RS Test | 45.9% | 107.7 | 155.5% | ||
| 2004 | 9.0% | Without RS Test | 0.8% | 44.3 | 6.4% |
| With RS Test | 4.1% | 72.4 | 20.8% | ||
| 2005 | 3.0% | Without RS Test | 9.4% | 61.5 | 55.7% |
| With RS Test | 15.0% | 99.6 | 54.9% | ||
| Overall | 47.2% | Without RS Test | 10.2% | 53.3 | 69.8% |
| With RS Test | 23.0% | 93.0 | 90.1% | ||
The results show that allowing stocks to run when their RS Rank has not fallen below the RS Rank at breakout improves the overall returns. The results also imply that the effect is increased as the overall market gains strength as shown by the change in the S&P 500 in each year. For example, in 2005, when the S&P 500 gained only 3%, the RS Rank test made little or no difference, but in 2003, 2004 and overall, the improvement obtained when using the RS Rank was quite marked.
The above backtest was run without using a stop loss % as we have found previously that our Sell Assistant gave better results when no stop loss was used. As you know, William O'Neil recommends selling a stock when it has fallen 7-8% so it is important to know what effect using an 8% stop loss will have on the returns using our new RS rank test. We have therefore run the backtest using an 8% stop-loss where we sell if the close is 8% or more below the buy price but we do not sell if the stop loss was not met and the Sell Assistant signals a sell but the RS rank has not fallen below the RS rank at breakout. This gives the following results.
| Year | S&P Gain | Test | Average Gain | Average Hold Days | Annualized Return |
|---|---|---|---|---|---|
| 2003 | 31.1% | With 8% stop and RS Rank Test | 41.1% | 91.6 | 163.9% |
| 2004 | 9.0% | With 8% stop and RS Rank Test | 5.19% | 60.3 | 31.43% |
| 2005 | 3.0% | With 8% stop and RS Rank Test | 13.48% | 86.7 | 39.67% |
| Overall | 47.2% | With 8% stop and RS Rank Test | 21.09% | 79.2 | 97.3% |
This is an extremely interesting result. It shows that not using a stop loss has a slight edge in the average gain on each position, overall and in years 2003 and 2005, but that the annualized return is improved because the average hold time per position is shortened.
Using the stop loss has two impacts compared to not using it:
- some gains are foregone because the stock bounces back
- some deeper losses are avoided.
It is instructive to look at these impacts on an individual case basis because the effect is masked by the averages above. They are summarized in the next table:
| Stop Loss Effect | No. of Cases |
Total % Difference |
Avg. % Difference |
|---|---|---|---|
| Gains foregone because the stock bounces back | 28 | 813.5 | 29% |
| Deeper losses avoided | 52 | 318.5 | 6.1% |
Now we see that by using the 8% stop loss, one forgoes an average 29% gain while avoiding an average 6.1% loss.
Continuing our policy of transparency, you can see the data from which the above results were derived here. We invite you to dig into them and draw your own conclusions. We would love to hear your views and critiques. Please post them to the Breakoutwatch Strategies > Using the Sell Assistant forum.
Conclusion
Using an 8% stop loss can marginally improve returns overall when used with the Sell Assistant. This reverses our earlier advice that returns are better if a stop loss is not used with the Sell Assistant. However, on an individual case basis, you risk foregoing a gain of 29% versus avoiding a further loss of 6%.
In view of these conclusions, we are adjusting the default behavior of the Sell Assistant to use the RS Rank test before issuing a sell alert BUT you can override that default behavior using the new Sell Assistant setup form described above. We will continue to use no stop loss in the results shown in the TradeWatch History tables.
If you think our service has great potential but you are too busy, or find it too complex, you should consider talking to one of the investment advisors listed below who use our service to generate great returns for their clients.
Investment Advisors Using our Service
TradeRight Securities, located in a suburb of Chicago, is a full services investment management company and broker/dealer. They have been a subscriber, and user, of BreakoutWatch.com for some time now. They practice CANTATA and use Breakoutwatch.com as a “research analyst”. You can learn more about TradeRight Securities at: www.traderightsecurities.com. If you’re interested in speaking to a representative, simply call them toll-free at 1-800-308-3938 or e-mail gdragel@traderightsecurities.com.
PivotPoint Advisors, LLC takes a technical approach to investment planning and management. A breakoutwatch.com subscriber since May, 2004, they use breakouts, market signals, and now TradeWatch to enhance returns for their clients. Learn more at http://pivotpointadvisors.net or contact John Norquay at 608-826-0840 or by email at john.norquay@pivotpointadvisors.net.
Note to advisors: If you would like to be listed here, please contact us. As a service to those who subscribe to us, there is no additional charge to be listed here.
Get a 14 day Trial of our premium 'Platinum' service for just $9.95 and if you subsequently subscribe to any subscription level we will credit your $9.95 to your subscription. 14
Day Platinum Trial |
| Index | Value | Change Week | Change YTD | Market1 Signal |
||||||||||||||||||||||||||||||||||||
|---|---|---|---|---|---|---|---|---|---|---|---|---|---|---|---|---|---|---|---|---|---|---|---|---|---|---|---|---|---|---|---|---|---|---|---|---|---|---|---|---|
| Dow | 11577.7 | 1.85% | 8.03% | enter | ||||||||||||||||||||||||||||||||||||
| NASDAQ | 2342.57 | 0.86% | 6.22% | enter | ||||||||||||||||||||||||||||||||||||
| S&P 500 | 1325.76 | 1.16% | 6.21% | enter | ||||||||||||||||||||||||||||||||||||
1The Market Signal is derived from our proprietary
market model. The market model is described on the site. 2The site also shows industry rankings based on fundamentals, combined technical and fundamentals, and on price alone (similar to IBD). The site also shows daily industry movements. |
||||||||||||||||||||||||||||||||||||||||
# of Breakouts
|
Period Average1
|
Max. Gain During Period2
|
Gain at Period Close3
|
|
|---|---|---|---|---|
| This Week | 39 | 26.85 | 4.66% | 0.8% |
| Last Week | 38 | 27.62 | 5.27% | 2.14% |
| 13 Weeks | 406 | 30.08 | 13.99% |
6.28% |
Sector
|
Industry
|
Breakout Count for Week
|
|---|---|---|
Mining
|
Mining-Gold/Silver/Gems
|
2
|
Oil & Gas
|
Oil & Gas-U S Explr/Prod
|
2
|
Real Estate/ REIT
|
Real Estate-REIT
|
2
|
Retail
|
Retail-Discount/Variety
|
2
|
Special
|
Special-ClsdEndFunds/Bond
|
2
|
Telecomm
|
Telecomm-Equipment
|
2
|
Auto & Truck
|
Auto & Truck-OEM
|
1
|
Auto & Truck
|
Auto & Truck-Repl Prts
|
1
|
Building
|
Building-Mobile/Mfg/RV
|
1
|
Chemical
|
Chemical-Basic
|
1
|
Computer
|
Computer-Services
|
1
|
Computer Software
|
Comp Software-Security
|
1
|
Computer Software
|
Comp Software-Enterprise
|
1
|
Diversified Operations
|
Diversified Operations
|
1
|
Electronics
|
Electr-Equipment
|
1
|
Electronics
|
Electr-Semicndtr Equip
|
1
|
Electronics
|
Electr-Misc Products
|
1
|
Finance
|
Finance-Savings&Loan
|
1
|
Finance
|
Finance-Consumer Loans
|
1
|
Finance
|
Finance-Brokers
|
1
|
Healthcare
|
Healthcare-Instruments
|
1
|
Internet
|
Internet-E:Commerce
|
1
|
Leisure
|
Leisure-Htls/Mtls
|
1
|
Mining
|
Mining-Misc Ores
|
1
|
Oil & Gas
|
Oil & Gas-Refining/Mktg
|
1
|
Paper
|
Paper
|
1
|
Personal
|
Personal -Cosmetics
|
1
|
Retail
|
Retail-Misc/Diversified
|
1
|
Retail
|
Retail-Restaurant
|
1
|
Retail
|
Retail-Apparel
|
1
|
Steel
|
Steel -Producers
|
1
|
Transportation
|
Transportation-Equip Mfg
|
1
|
Utility
|
Utility-Gas
|
1
|
2This represents the return if each stock were bought at its breakout price and sold at its intraday high.
3This represents the return if each stock were bought at its breakout price and sold at the most recent close.
Category |
Symbol |
Company Name |
Expected Gain1 |
|---|---|---|---|
| Best Overall | SWB | Smith & Wesson Hldg Corp | 89 |
| Top Technical | STIZ | Scientific Technologies | 72 |
| Top Fundamental | SWN | Southwestern Energy Co | 36 |
| Top Tech. & Fund. | ARD | Arena Resources Inc | 33 |
Category |
Symbol |
Company Name |
Expected Gain1 |
|---|---|---|---|
| Best Overall | SIM | Grupo Simec S A Adr | 77 |
| Top Technical | SPNC | Spectranetics Corp. The | 65 |
| Top Fundamental | CHB | Champion Enterprises Inc | 46 |
| Top Tech. & Fund. | HLF | Herbalife | 34 |
If you received this newletter from a friend and you would like to receive it regularly please go to the BreakoutWatch.com site and enter as a Guest. You will then be able to register to receive the newsletter.
Copyright © 2006 NBIcharts, LLC dba BreakoutWatch.com. All rights reserved.