| Market Summary | Weekly Breakout Report | Top Breakout Choices | Top 2nd Chances | New Features | Tip of the Week |
Market Summary
NASDAQ Market Signal at Enter
After a cautious start ahead of the FOMC meeting, the week's events left investors feeling pretty confident that the proverbial soft-landing was achievable after all. Reassurance came from:
- the FOMC statement that confirmed the economy remained on a steady growth path with inflation pressures moderating and signs that the housing market was recovering. Fears that the statement would take a more hawkish tone regarding the possible need to raise rates were unfounded and all 11 members of the committee voted to hold rates steady. The one member who has dissented for the last four meetings does not have a vote this year.
- core consumer prices rose just 0.1% in December confirming that inflation is moderating consistent with the FOMC's statement. This was further reassurance that although interest rates may not fall this year, they are unlikely to rise either.
- a report that consumer spending rose significantly in December.
- the economy added fewer jobs than expected in January, indicating caution in hiring and therefore a slower growth outlook
- but hourly wages inched up only 0.2% thereby keeping inflationary pressures low.
- A jump in factory order in December
- a rise in consumer sentiment.
Profit taking on Friday held the DJI's gain for the week to 1.33% while the NASDAQ Composite added a healthy 2.51% and the S&P did even better with a 1.84% gain. The NASDAQ is once again the best performer for the year with a 2.51% gain.
The NASDAQ's performance this week led us to take the exceptional and unusual step of overriding the market model and setting the signal back to 'enter'. We did so because on Thursday the NASDAQ Composite closed 2% above its low set on January 26 which would have been more than sufficient to cause our market model to revert to 'enter' for this index provided Thursday had been an accumulation day. Volumes were 10% above average but that was not sufficient to exceed Wednesday's exceptionally strong volume following the positive FOMC statement. Taking into account the volume for the two days, and the timing of the FOMC statement, we felt it was within the spirit of the model to manually override it this once.
The environment for the markets looks benign but there are still curmudgeonly voices threatening that the sky is falling, such as Nouriel Roubini. Nevertheless, it often happens that when there is general agreement that all is well that something comes along to shatter the conventional wisdom. While the markets continue to make new highs, we can expect it to continue to be skittish.
The number of breakouts shot up to 53 this week and we saw some double digit gains for the first time in quite a while. Big gainers were REFR (30.1%), ATRC (15.8%) and HGR (11.7%). By the end of the week the average breakout had gained 2.7%, comfortably beating the indexes, and for the last two weeks, the average gain was a very healthy 20.71%.
| Get a 14 day Trial of our premium 'Platinum'
service and TradeWatch for just $9.95 and if you subsequently subscribe
to any subscription level we will credit your $9.95 to your subscription.
14
Day Platinum Trial |
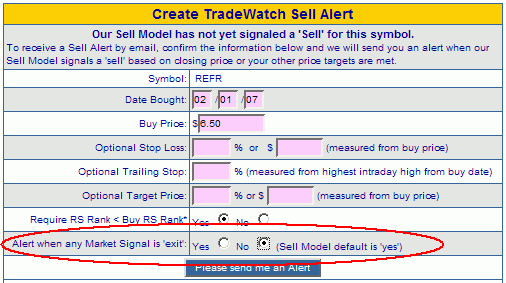
The Sell Assistant was enhanced to allow an override of the default behavior of issuing a Sell Alert immediately any market signal goes to 'exit'. This was achieved by adding a new option to the form that sets up the Sell Alert:

You can also edit any existing alerts that have not yet been activated to apply this override from the 'Sell Alerts'menu choice on the TradeWatch page.
Sell Assistant Options now Consistent with Portfolio Simulation
In the Newsletter of 12/09/2006 we introduced additional options for the TradeWatch Portfolio Simulation tool. Among these was the option to run a simulation on the assumption that positions were not closed immediately and we showed that the best returns during 2006 were obtained when that option was selected.
This was inconsistent with the options available when setting up an alert which did not allow an override of the Sell Assistants default behavior, which was to always issue a sell alert as soon as a market signal went to exit. The enhancement introduced this week and described above corrects this inconsistency.
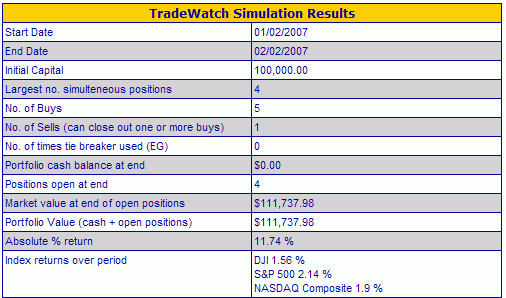
Running the portfolio simulation on the Buy at Open list since the start of the year, with the default options but ignoring the market signal gives a return of 11.74%

We still believe that the market signals provide better returns over the long term, but over shorter periods, such as the month of January, there will inevitably times when the returns are sub-optimum. It is inevitably a matter of judgement as to how to play the markets at any moment in time. Our tools, such as the portfolio simulation tool, can hopefully help you make more informed and therefore better judgments.
Investment Advisors Using our Service
TradeRight Securities, located in a suburb of Chicago, is a full services investment management company and broker/dealer. They have been a subscriber, and user, of BreakoutWatch.com for some time now. They practice CANTATA and use Breakoutwatch.com as a “research analyst”. You can learn more about TradeRight Securities at: www.traderightsecurities.com. If you’re interested in speaking to a representative, simply call them toll-free at 1-800-308-3938 or e-mail gdragel@traderightsecurities.com.
PivotPoint Advisors, LLC takes a technical approach to investment planning and management. A breakoutwatch.com subscriber since May, 2004, they use breakouts, market signals, and now TradeWatch to enhance returns for their clients. Learn more at http://pivotpointadvisors.net or contact John Norquay at 608-826-0840 or by email at john.norquay@pivotpointadvisors.net.
Note to advisors: If you would like to be listed here, please contact us. As a service to those who subscribe to us, there is no additional charge to be listed here.
| Get a 14 day Trial of
our premium 'Platinum' service and TradeWatch for just $9.95 and
if you subsequently subscribe to any subscription
level we will credit your $9.95 to your subscription.
14
Day Platinum Trial |
| Index | Value | Change Week | Change YTD | Market1 Signal |
||||||||||||||||||||||||||||||||||||
|---|---|---|---|---|---|---|---|---|---|---|---|---|---|---|---|---|---|---|---|---|---|---|---|---|---|---|---|---|---|---|---|---|---|---|---|---|---|---|---|---|
| Dow | 12653.5 | 1.33% | 1.53% | enter | ||||||||||||||||||||||||||||||||||||
| NASDAQ | 2475.88 | 1.66% | 2.51% | enter | ||||||||||||||||||||||||||||||||||||
| S&P 500 | 1448.39 | 1.84% | 2.12% | enter | ||||||||||||||||||||||||||||||||||||
1The Market Signal is derived from our proprietary
market model. The market model is described on the site. 2The site also shows industry rankings based on fundamentals, combined technical and fundamentals, and on price alone (similar to IBD). The site also shows daily industry movements. |
||||||||||||||||||||||||||||||||||||||||
# of Breakouts
|
Period Average1
|
Max. Gain During Period2
|
Gain at Period Close3
|
|
|---|---|---|---|---|
| This Week | 53 | 23.38 | 4.76% | 2.66% |
| Last Week | 35 | 22 | 7.6% | 20.71% |
| 13 Weeks | 361 | 25.38 | 10.89% |
4.73% |
Sector
|
Industry
|
Breakout Count for Week
|
|---|---|---|
ELECTRONICS
|
Scientific & Technical Instruments
|
3
|
FINANCIAL SERVICES
|
Closed-End Fund - Equity
|
3
|
COMPUTER SOFTWARE & SERVICES
|
Business Software & Services
|
2
|
DRUGS
|
Biotechnology
|
2
|
INSURANCE
|
Property & Casualty Insurance
|
2
|
MANUFACTURING
|
Industrial Electrical Equipment
|
2
|
METALS & MINING
|
Industrial Metals & Minerals
|
2
|
TELECOMMUNICATIONS
|
Wireless Communications
|
2
|
BANKING
|
Savings & Loans
|
1
|
COMPUTER SOFTWARE & SERVICES
|
Security Software & Services
|
1
|
COMPUTER SOFTWARE & SERVICES
|
Healthcare Information Services
|
1
|
CONGLOMERATES
|
Conglomerates
|
1
|
CONSUMER DURABLES
|
Toys & Games
|
1
|
CONSUMER NON-DURABLES
|
Paper & Paper Products
|
1
|
CONSUMER NON-DURABLES
|
Cleaning Products
|
1
|
DIVERSIFIED SERVICES
|
Business Services
|
1
|
DIVERSIFIED SERVICES
|
Research Services
|
1
|
DRUGS
|
Drug Manufacturers - Other
|
1
|
ELECTRONICS
|
Semiconductor Equipment & Materials
|
1
|
ENERGY
|
Independent Oil & Gas
|
1
|
FINANCIAL SERVICES
|
Closed-End Fund - Foreign
|
1
|
FOOD & BEVERAGE
|
Processed & Packaged Goods
|
1
|
HEALTH SERVICES
|
Medical Appliances & Equipment
|
1
|
HEALTH SERVICES
|
Medical Instruments & Supplies
|
1
|
HEALTH SERVICES
|
Specialized Health Services
|
1
|
INSURANCE
|
Life Insurance
|
1
|
INSURANCE
|
Accident & Health Insurance
|
1
|
INTERNET
|
Internet Service Providers
|
1
|
INTERNET
|
Internet Software & Services
|
1
|
MANUFACTURING
|
Diversified Machinery
|
1
|
MANUFACTURING
|
Metal Fabrication
|
1
|
MATERIALS & CONSTRUCTION
|
Cement
|
1
|
REAL ESTATE
|
REIT - Diversified
|
1
|
REAL ESTATE
|
REIT - Healthcare Facilities
|
1
|
REAL ESTATE
|
Property Management
|
1
|
TELECOMMUNICATIONS
|
Processing Systems & Products
|
1
|
TELECOMMUNICATIONS
|
Telecom Services - Domestic
|
1
|
TOBACCO
|
Cigarettes
|
1
|
TRANSPORTATION
|
Air Delivery & Freight Services
|
1
|
TRANSPORTATION
|
Shipping
|
1
|
UTILITIES
|
Electric Utilities
|
1
|
WHOLESALE
|
Food Wholesale
|
1
|
2This represents the return if each stock were bought at its breakout price and sold at its intraday high.
3This represents the return if each stock were bought at its breakout price and sold at the most recent close.
Category |
Symbol |
Company Name |
Expected Gain1 |
|---|---|---|---|
| Best Overall | ENPT | En Pointe Technologies | 108 |
| Top Technical | ENPT | En Pointe Technologies | 108 |
| Top Fundamental | VCLK | Valueclick Inc | 48 |
| Top Tech. & Fund. | TALX | Talx Corporation | 34 |
Category |
Symbol |
Company Name |
Expected Gain1 |
|---|---|---|---|
| Best Overall | STKL | Sunopta Inc | 85 |
| Top Technical | WHIT | Whittier Energy Corp | 68 |
| Top Fundamental | QSII | Quality Systems Inc | 0 |
| Top Tech. & Fund. | QSII | Quality Systems Inc | 0 |
If you received this newletter from a friend and you would like to receive it regularly please go to the BreakoutWatch.com site and enter as a Guest. You will then be able to register to receive the newsletter.
Copyright © 2007 NBIcharts, LLC dba BreakoutWatch.com. All rights reserved.
" BreakoutWatch," the BreakoutWatch.com "eye" logo, and the slogan "tomorrow's breakouts today" are service marks of NBIcharts LLC. All other marks are the property of their respective owners, and are used for descriptive purposes only.