| Market Summary | Weekly Breakout Report | Top Breakout Choices | Top 2nd Chances | New Features | Tip of the Week |
Market Summary
Market Adjusts and Growth Stocks are Back in Favor
This week the markets adjusted their expectations on interest rate cuts. Investors have pushed stocks up on the expectation that an interest rate cut was likely later this year but evidence of an improving economy and a still higher than desirable inflation rate led investors to the realization that a rate cut is unlikely this year, and there may even be an increase of the overnight Fed funds rate to 5.5%. Consequently, investors took profits and all three indexes dropped sharply on a succession of three distribution days.
We saw this coming on Monday, when an article on Bloomberg.com caught our eye. It drew attention to the treasury options market increasingly favoring an interest rate increase by the Fed before year's end . We warned that this was contrary to the conventional wisdom that a rate cut later in the year was most likely and that a change in the bullish sentiment was likely when investors took notice. Just a day later, Fed Chairman Bernanke said that growth was rebounding while inflation remained 'somewhat elevated'. Further evidence of a strengthening economy was also provided by the Institute of Supply Management who reported that their index of service sector activity jumped to 59.7 while the consensus expectation was for it to be steady at 56.
By Friday, however, investors had adjusted to the new reality and recognized that an expanding economy with interest rates at their current level wasn't necessarily bad for stocks and the major indexes made substantial gains to recover a third of their losses. Friday's close left the indexes at their highs of the day on volume that was above average for a Friday session. For the week, the DJI lost 1.78%, the S&P 500 dropped 1.87% while the NASADQ Composite lost just 1.54%. This was the third week in succession that the growth oriented NASDAQ Composite has outperformed the other three major indexes.
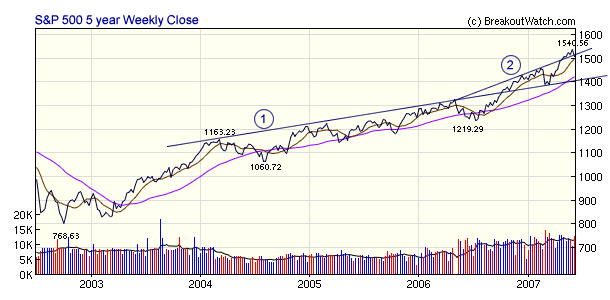
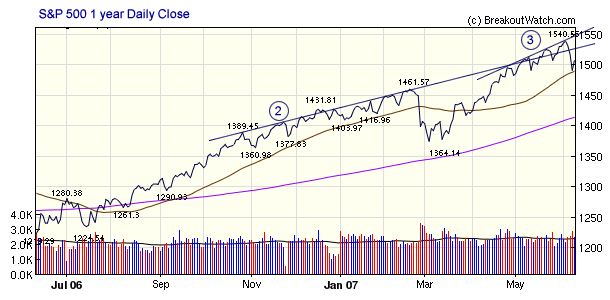
We think this week's adjustment is a healthy sign that the markets could be coming to their senses. While there could be some short term turbulence, stocks will resume their upward march after a short correction. The following charts of the S&P 500 show that there have been three rates of growth for the index over the last five years, with the most recent rate of growth well out of line with what could be sustainable over the longer term. A 5 year chart shows that the rate of growth of the S&P 500 kicked up following last year's correction. and the 1 year chart shows that the rate accelerated again over the last two months.


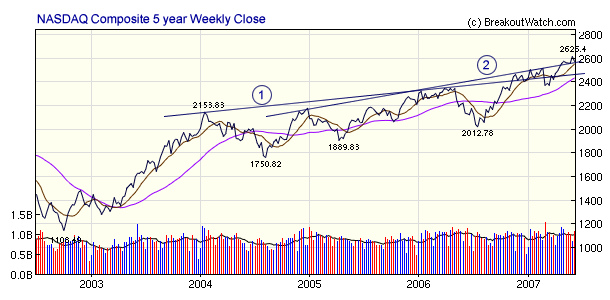
In contrast, The NASDAQ, which has under performed the larger cap stocks this year, has not become similarly over-extended and we can expect a smaller correction, if any, and that an expanding economy will favor growth stocks again.

The number of confirmed breakouts dropped to 12 this week, but they were a classy bunch that gained 2.8% by week's end, easily beating the major indexes. Only one failed, and four closed above the 5% range. Dyncorp International (DCP) rose 24.2% over its pivot before closing the week with a 12.6% gain.
There were no new features added this week.
Daily and Weekly Market Commentary Objectives
There are countless sources of daily analysis of the markets and blow-by-blow descriptions of the day's winners and losers. All of these are easily accessible to our subscribers, and by the time they read our daily or weekly commentary they will already be well informed of the days events. For this reason, we keep our summary of the day's or week's 'news' to a few words only.
Instead, we try to focus on the underlying trends that may affect market movements in the coming days. To do so we look at the following factors. We may not touch on all of them each day or week, because not all of them will be relevant, but we consider each of them when preparing our commentary.
Daily Commentary
- Percentage movement of the major indexes. We ignore points changes in the indexes because they are not useful for comparative purposes.
- Daily volume compared to the 50 day moving average because it represents the level of investor participation in the markets
- Accumulation/distribution indicates a change in sentiment. Accumulation means investors are more bullish, distribution that they are more bearish.
- Distribution day count. These are important inputs into our market model.
- You can get an instant summary of the information above on our 'equivolume chart' for each index.
- Economic data that affected the day's movements and may influence the future trend.
- Data due for release that could influence the coming day(s) trading
Weekly Commentary
In our weekly commentary we take the time to analyze trends and influences in more detail. This will often include a discussion of economic trends. While the markets are said to be leading indicator of economic activity, they achieve that status by constantly adjusting to new economic information, so an understanding of economic trends and their likely influence on markets is essential. We usually include a technical analysis of at least one chart to illustrate where the market has been and where it may be headed. We often focus on the NASDAQ Composite because the NASDAQ is most representative of growth stocks. It is also the most volatile market and the one where the biggest gains (and losses) can generally be obtained.
Investment Advisors Using our Service
TradeRight Securities, located in a suburb of Chicago, is a full services investment management company and broker/dealer. They have been a subscriber, and user, of BreakoutWatch.com for some time now. They practice CANTATA and use Breakoutwatch.com as a “research analyst”. You can learn more about TradeRight Securities at: www.traderightsecurities.com. If you’re interested in speaking to a representative, simply call them toll-free at 1-800-308-3938 or e-mail gdragel@traderightsecurities.com.
Note to advisors: If you would like to be listed here, please contact us. As a service to those who subscribe to us, there is no additional charge to be listed here.
| Get a 14 day Trial of
our premium 'Platinum' service and TradeWatch for just $9.95 and
if you subsequently subscribe to any subscription
level we will credit your $9.95 to your subscription.
14
Day Platinum Trial |
| Index | Value | Change Week | Change YTD | Market1 Signal |
||||||||||||||||||||||||||||||||||||
|---|---|---|---|---|---|---|---|---|---|---|---|---|---|---|---|---|---|---|---|---|---|---|---|---|---|---|---|---|---|---|---|---|---|---|---|---|---|---|---|---|
| Dow | 13424.4 | -1.78% | 7.71% | enter | ||||||||||||||||||||||||||||||||||||
| NASDAQ | 2573.54 | -1.54% | 6.55% | enter | ||||||||||||||||||||||||||||||||||||
| S&P 500 | 1507.67 | -1.87% | 6.3% | enter | ||||||||||||||||||||||||||||||||||||
1The Market Signal is derived from our proprietary
market model. The market model is described on the site. 2The site also shows industry rankings based on fundamentals, combined technical and fundamentals, and on price alone (similar to IBD). The site also shows daily industry movements. |
||||||||||||||||||||||||||||||||||||||||
# of Breakouts
|
Period Average1
|
Max. Gain During Period2
|
Gain at Period Close3
|
|
|---|---|---|---|---|
| This Week | 12 | 18.38 | 6.97% | 2.76% |
| Last Week | 29 | 18.08 | 5.58% | 0.31% |
| 13 Weeks | 302 | 19 | 11.89% |
2.31% |
Sector
|
Industry
|
Breakout Count for Week
|
|---|---|---|
BANKING
|
Regional - Northeast Banks
|
1
|
COMPUTER SOFTWARE & SERVICES
|
Information Technology
|
1
|
CONSUMER NON-DURABLES
|
Paper & Paper Products
|
1
|
DIVERSIFIED SERVICES
|
Business Services
|
1
|
ELECTRONICS
|
Scientific & Technical Instruments
|
1
|
ENERGY
|
Oil & Gas Equipment & Services
|
1
|
FOOD & BEVERAGE
|
Beverages - Soft Drinks
|
1
|
HEALTH SERVICES
|
Medical Appliances & Equipment
|
1
|
HEALTH SERVICES
|
Medical Practitioners
|
1
|
RETAIL
|
Discount, Variety Stores
|
1
|
TELECOMMUNICATIONS
|
Telecom Services - Foreign
|
1
|
TELECOMMUNICATIONS
|
Communication Equipment
|
1
|
2This represents the return if each stock were bought at its breakout price and sold at its intraday high.
3This represents the return if each stock were bought at its breakout price and sold at the most recent close.
Category |
Symbol |
Company Name |
Expected Gain1 |
|---|---|---|---|
| Best Overall | KOSN | Kosan Biosciences Inc | 95 |
| Top Technical | ARWR | Arrowhead Research Corp | 73 |
| Top Fundamental | CPX | Complete Production Services Inc | 23 |
| Top Tech. & Fund. | CPX | Complete Production Services Inc | 23 |
Category |
Symbol |
Company Name |
Expected Gain1 |
|---|---|---|---|
| Best Overall | HGRD | Health Grades Inc | 93 |
| Top Technical | HGRD | Health Grades Inc | 93 |
| Top Fundamental | OMNI | Omni Energy Services Cp | 69 |
| Top Tech. & Fund. | HGRD | Health Grades Inc | 93 |
If you received this newletter from a friend and you would like to receive it regularly please go to the BreakoutWatch.com site and enter as a Guest. You will then be able to register to receive the newsletter.
Copyright © 2007 NBIcharts, LLC dba BreakoutWatch.com. All rights reserved.
" BreakoutWatch," the BreakoutWatch.com "eye" logo, and the slogan "tomorrow's breakouts today" are service marks of NBIcharts LLC. All other marks are the property of their respective owners, and are used for descriptive purposes only.