| Market Summary | Weekly Breakout Report | Top Breakout Choices | Top 2nd Chances | New Features | Tip of the Week |
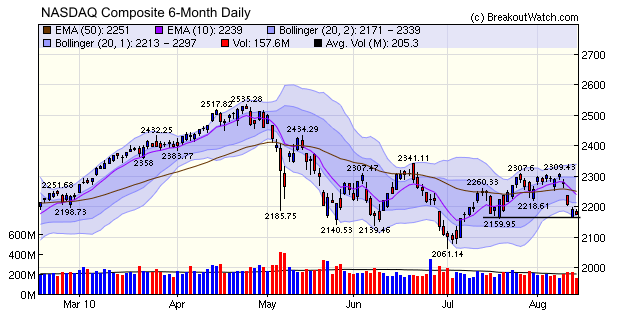
Our market trend indicator turned negative for the Russell 2000 on Thursday and for the NASDAQ Composite on Friday (more on the trend indicators below).
Regular readers of this newsletter will know that we have been focusing on the Consumer Metrics Institute's Daily Growth Index in recent weeks. That index predicted the economic slowdown we saw in the second quarter and continues to show that the economic environment will worsen. If GDP trends continue to follow the Daily Growth Index downwards then we can anticipate the bear market in equities will worsen in the months to come, unless more stimulative "quantitative easing" by the Federal Reserve than has been undertaken so far materializes.
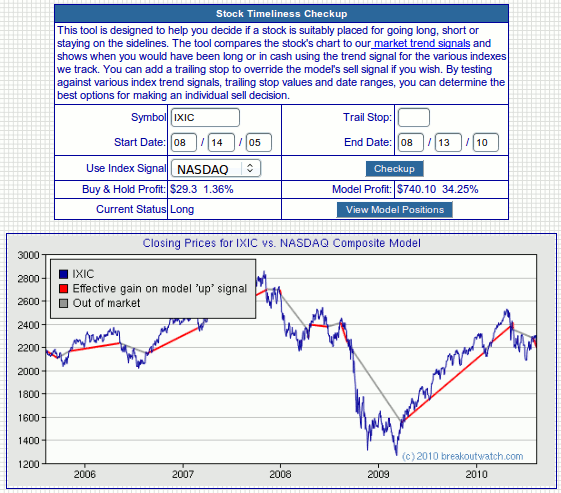
This can now be done using our Stock Timeliness Checkup (menu choice: Evaluate > Analytical Tools) by using our index symbol in place of a stock symbol. The index symbols to use are:
NASDAQ Composite: IXIC
S&P 500: SPX
Dow Jones 30: DJI
Russell 2000: RUT
Wilshire 5000: DWT
For example, enter IXIC as the symbol and choose NASDAQ as the index signal. The results show that if you had bought the NASDAQ Composite 5 years ago at2160.97 and sold on Thursday night, you would have made a profit of just : $29.30 (1.36%) but if you had bought and sold using the trend indicator you would have made $740.10 (34.25%).
| Index | Value | Change Week | Change YTD | Trend | ||||||||||||||||||||||||||||||||||||
|---|---|---|---|---|---|---|---|---|---|---|---|---|---|---|---|---|---|---|---|---|---|---|---|---|---|---|---|---|---|---|---|---|---|---|---|---|---|---|---|---|
| Dow | 10303.2 | -3.29% | -1.2% | Up | ||||||||||||||||||||||||||||||||||||
| NASDAQ | 2173.48 | -5.02% | -4.22% | Down | ||||||||||||||||||||||||||||||||||||
| S&P 500 | 1079.25 | -3.78% | -3.21% | Up | ||||||||||||||||||||||||||||||||||||
| Russell 2000 | 609.49 | -6.33% | -3.88% | Down | ||||||||||||||||||||||||||||||||||||
| Wilshire 5000 | 11203.5 | -4.08% | -2.56% | Up | ||||||||||||||||||||||||||||||||||||
1The Market Signal is derived from our proprietary
market model. The market model is described on the site. 2The site also shows industry rankings based on fundamentals, combined technical and fundamentals, and on price alone. The site also shows daily industry movements. |
||||||||||||||||||||||||||||||||||||||||
# of Breakouts |
Period Average1 |
Max. Gain During Period2 |
Gain at Period Close3 |
|
|---|---|---|---|---|
| This Week | 14 | 9.92 | 5.74% | -2.24% |
| Last Week | 36 | 8.92 | 8.84% | -1.41% |
| 13 Weeks | 135 | 10.54 | 14.52% |
2.58% |
2This represents the return if each stock were bought at its breakout price and sold at its intraday high.
3This represents the return if each stock were bought at its breakout price and sold at the most recent close.
Category |
Symbol |
Company Name |
Expected Gain1 |
|---|---|---|---|
| Best Overall | GRT | Glimcher Realty Trust | 119 |
| Top Technical | AEZ | American Oil & Gas Inc. | 106 |
| Top Fundamental | GSIT | GSI Technology Inc. | 103 |
| Top Tech. & Fund. | GSIT | GSI Technology Inc. | 103 |
Category |
Symbol |
Company Name |
Expected Gain1 |
|---|---|---|---|
| Best Overall | MBI | MBIA Inc. | 88 |
| Top Technical | MBI | MBIA Inc. | 88 |
| Top Fundamental | LSTZA | Liberty Starz Group | 36 |
| Top Tech. & Fund. | LSTZA | Liberty Starz Group | 36 |
If you received this newsletter from a friend and you would like to receive it regularly please go to the BreakoutWatch.com site and enter as a Guest. You will then be able to register to receive the newsletter.
Copyright © 2010 NBIcharts, LLC dba BreakoutWatch.com.
All rights reserved.
"
BreakoutWatch," the BreakoutWatch.com "eye" logo, and the
slogan "tomorrow's breakouts today" are service marks of NBIcharts
LLC. All other marks are the property of their respective owners, and are
used for descriptive purposes only.
BreakoutWatch is not affiliated with Investor's Business Daily or with Mr. William O'Neil.
Our site, research and analysis is supported entirely by subscription and is free from advertising.