| Market Summary | Weekly Breakout Report | Top Breakout Choices | Top 2nd Chances | New Features | Tip of the Week |
After trending down on Tuesday through Thursday, the major indexes staged a strong rally on Friday that left the indexes with a nice gain for the week. Friday's bullish mood came after core capital expenditure for durable goods was better than expected and followed the Fed promising to keep interest rates low for an extended period. It was also clear they are ready to print more money, if necessary, as inflation expectations are currently low. Continued cheap money, with the promise of more to come, is good for asset prices, so as long the domestic economy does not threaten a double dip and global conditions continue to improve, then the markets will continue to move higher. In the global context, markets in South Korea, Thailand, Indonesia, India, Singapore and Philippines have risen to multi-year highs, and for Jakarta, to an all time high. (See Succinct summation of week’s events).
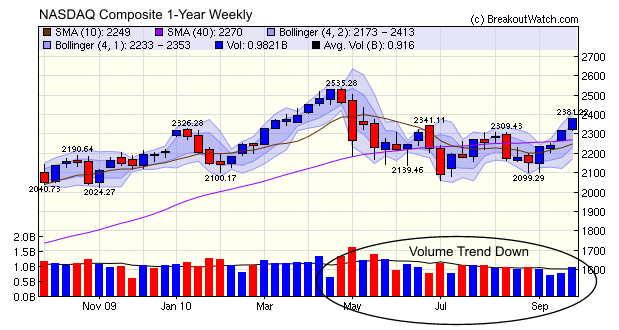
Also at The Big Picture, we had confirmation of what has been visible in our daily market commentaries and charts - volumes are falling.
"The Flash Crash [in May] erased $862 billion in
equity value in 20 minutes.
Since then through August, investors have withdrawn nearly $57 billion
from U.S. stock mutual funds, the most during any four-month period
since 2008, according to the Investment Company Institute. Third
quarter average daily trading volumes are down more than 25% from the
second quarter and down more than 15% year over year. "
A weekly chart of the NASDAQ Composite confirms the downward trend in volumes. NASDAQ volumes did rise above the 50 day average for the week, but the biggest volume days were the two distribution days on Tuesday and Wednesday, so although the index gained for the week, the contribution of volume to the gain is questionable. How long can the markets continue to rise if volume remains anemic?
The three mid-week down days kept the
number of breakouts below last weeks level at 38 but that was still
twice the 13 week average.
No new features this week
Limiting the Number of Email Alerts You Receive
Because we issue alerts when the breakout price is reached, regardless of the volume, a sudden spike in market valuations can lead to an excessively large number of alerts being issued.
When the markets opened on Friday, September 24, 2010, the leading indexes immediately gapped higher and had risen by over 1% by 10 am. In the first thirty minutes we issued 17 alerts and by the end of the day had issued a total of 67.
Of these, only 15 reached our nominal breakout volume of 1.5 times ADV with the result that your inbox was cluttered with many alerts which were never going to reach anything like a desirable volume level.
There are two ways you can limit the number of alerts you receive:
- Use a Personal Watchlist (PWL) to setup a list of stocks on which you only wish to receive alerts. If you haven't used the PWL mechanism, there are instructions on how to use it at our PWL Help page.
- Use filters to limit the characteristics of stocks on our watchlists so you only receive alerts when stocks meet your criteria. There is a video tutorial on how to do this.
How to Use Watchlist Filters
Not included in the
video is the new filters that control when alerts are issued based on
quasi-real time volume. These were described last week.
| Index | Value | Change Week | Change YTD | Trend | ||||||||||||||||||||||||||||||||||||
|---|---|---|---|---|---|---|---|---|---|---|---|---|---|---|---|---|---|---|---|---|---|---|---|---|---|---|---|---|---|---|---|---|---|---|---|---|---|---|---|---|
| Dow | 10860.3 | 2.38% | 4.15% | Up | ||||||||||||||||||||||||||||||||||||
| NASDAQ | 2381.22 | 2.83% | 4.94% | Up | ||||||||||||||||||||||||||||||||||||
| S&P 500 | 1148.67 | 2.05% | 3.01% | Up | ||||||||||||||||||||||||||||||||||||
| Russell 2000 | 671.01 | 3% | 5.83% | Up | ||||||||||||||||||||||||||||||||||||
| Wilshire 5000 | 11991.8 | 2.14% | 4.3% | Up | ||||||||||||||||||||||||||||||||||||
1The Market Signal is derived from our proprietary
market model. The market model is described on the site. 2The site also shows industry rankings based on fundamentals, combined technical and fundamentals, and on price alone. The site also shows daily industry movements. |
||||||||||||||||||||||||||||||||||||||||
# of Breakouts |
Period Average1 |
Max. Gain During Period2 |
Gain at Period Close3 |
|
|---|---|---|---|---|
| This Week | 38 | 18.38 | 4.26% | 2.86% |
| Last Week | 45 | 15.77 | 6.39% | 3.8% |
| 13 Weeks | 250 | 18.69 | 12.54% |
8.59% |
2This represents the return if each stock were bought at its breakout price and sold at its intraday high.
3This represents the return if each stock were bought at its breakout price and sold at the most recent close.
Category |
Symbol |
Company Name |
Expected Gain1 |
|---|---|---|---|
| Best Overall | OWW | Orbitz Worldwide, Inc. | 114 |
| Top Technical | URI | United Rentals, Inc. | 66 |
| Top Fundamental | LULU | Lululemon Athletica Inc. | 47 |
| Top Tech. & Fund. | LULU | Lululemon Athletica Inc. | 47 |
Category |
Symbol |
Company Name |
Expected Gain1 |
|---|---|---|---|
| Best Overall | GTE | Gran Tierra Energy, Inc. | 98 |
| Top Technical | GTE | Gran Tierra Energy, Inc. | 98 |
| Top Fundamental | RNOW | Rightnow Technologies Inc. | 60 |
| Top Tech. & Fund. | IGTE | iGate Corporation | 66 |
If you received this newsletter from a friend and you would like to receive it regularly please go to the BreakoutWatch.com site and enter as a Guest. You will then be able to register to receive the newsletter.
Copyright © 2010 NBIcharts, LLC dba BreakoutWatch.com.
All rights reserved.
"
BreakoutWatch," the BreakoutWatch.com "eye" logo, and the
slogan "tomorrow's breakouts today" are service marks of NBIcharts
LLC. All other marks are the property of their respective owners, and are
used for descriptive purposes only.
BreakoutWatch is not affiliated with Investor's Business Daily or with Mr. William O'Neil.
Our site, research and analysis is supported entirely by subscription and is free from advertising.